
News

16 Feb 2026 - 10k Words | February 2026
|
10k Words Equitable Investors February 2026 (2-minute read) Precious metals reacted savagely on the Kevin Warsh Fed Chair nomination. The "AI" capital drain bites for hyperscalers at the same time AI's rapidly improving capabilities bites for technology services. Government bond yields have been rising with low volatility amid broader market gyrations. Those gyrations were most apparent in the worst week since Covid-19 rocked markets in 2020 for Australia's small resources and large IT stocks. Valuation metrics in US tech - and software in particular - have taken a haircut. Regime change is apparent with the majority of stocks outperforming rather than the market being led by a few key stocks - both in the S&P 500 and among Australia's small caps. There is a huge dispersion in valuations among small caps to play with. Finally, US Office CMBS delinquency rate spiked to a record 12.3%! The "Warsh Effect" dents Gold and Silver price performance over past five years 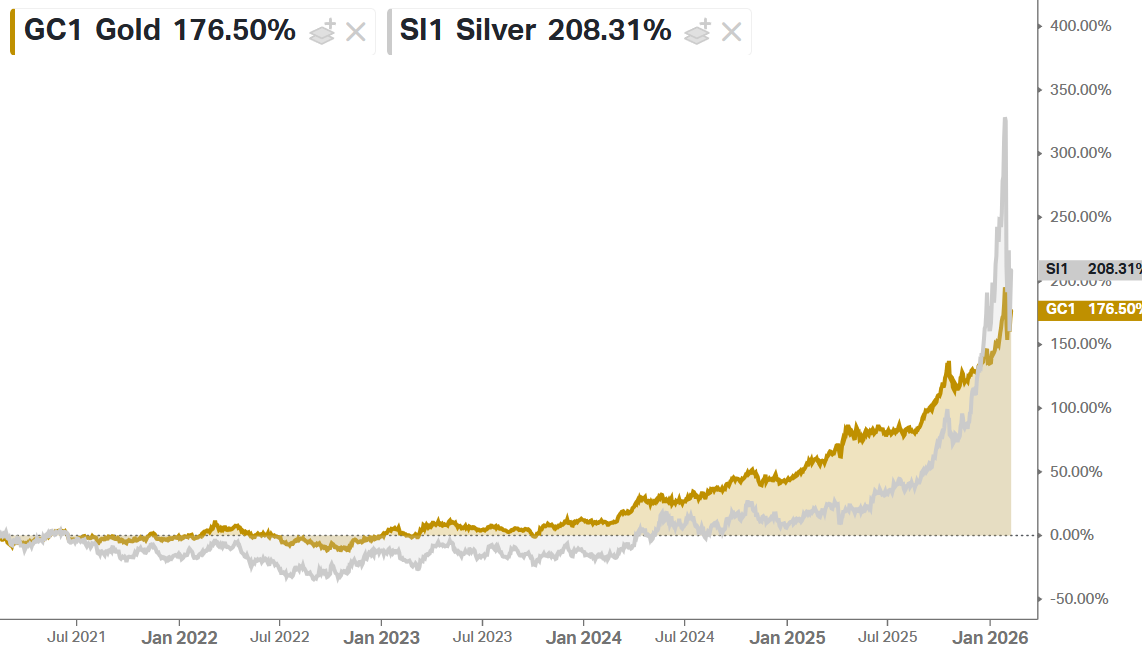
Source: Equitable Investors, Koyfin "AI" divergence - market punishing MSFT for high capex 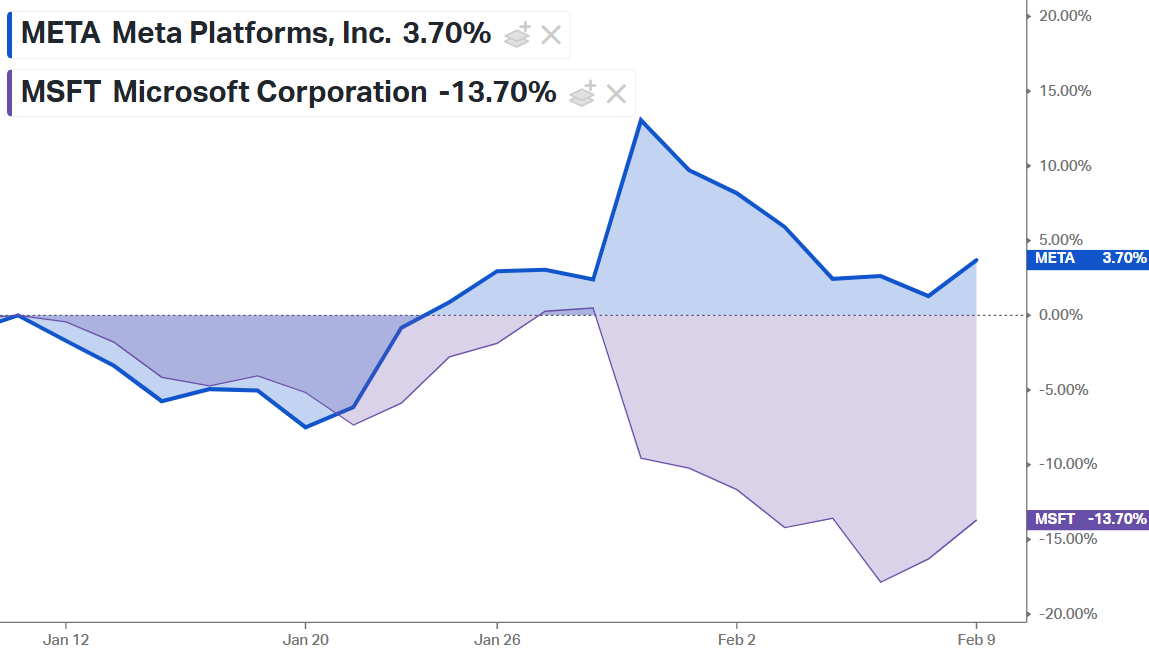
Source: Equitable Investors, Koyfin Capex as % of operating cash flow for "hyperscalers" (MSFT, AMZN, GOOGL, META, ORCL) 
Source: Bank of America Global Research Hyperscaler's combined capital expenditure in US dollars 
Source: Bloomberg India's IT services giants sold off on fears of IT disruption 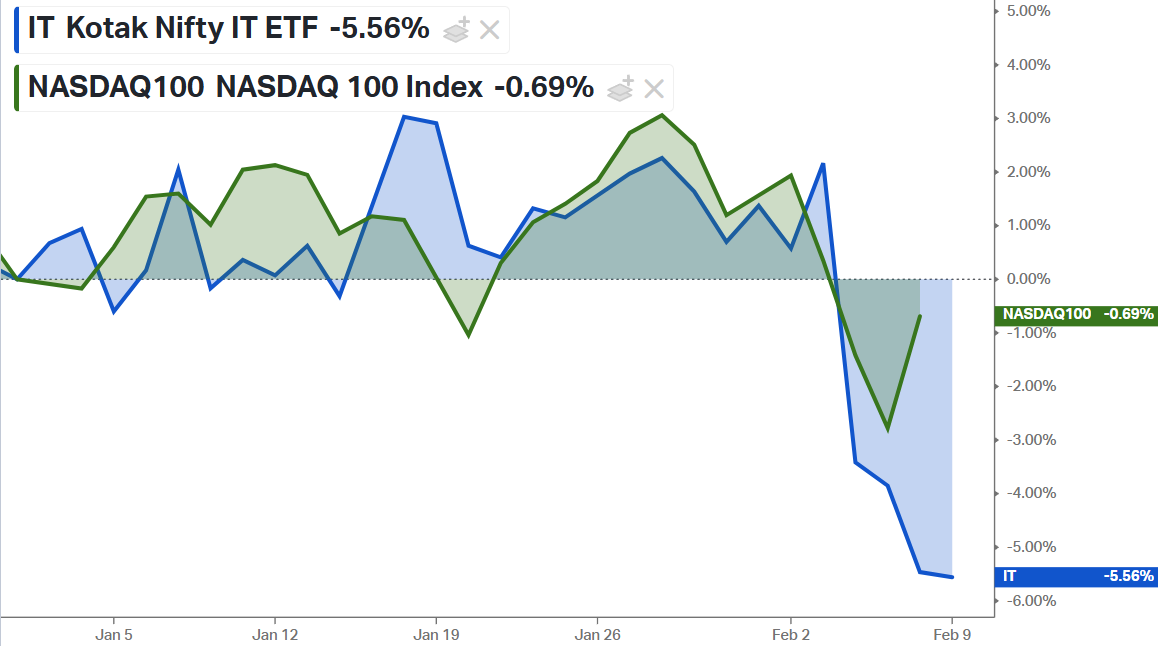
Source: Equitable Investors, Koyfin US 10 year bond yield relative to MOVE Index of implied bond market volatility; and Equitable Investors' Bond Market Sentiment indicator 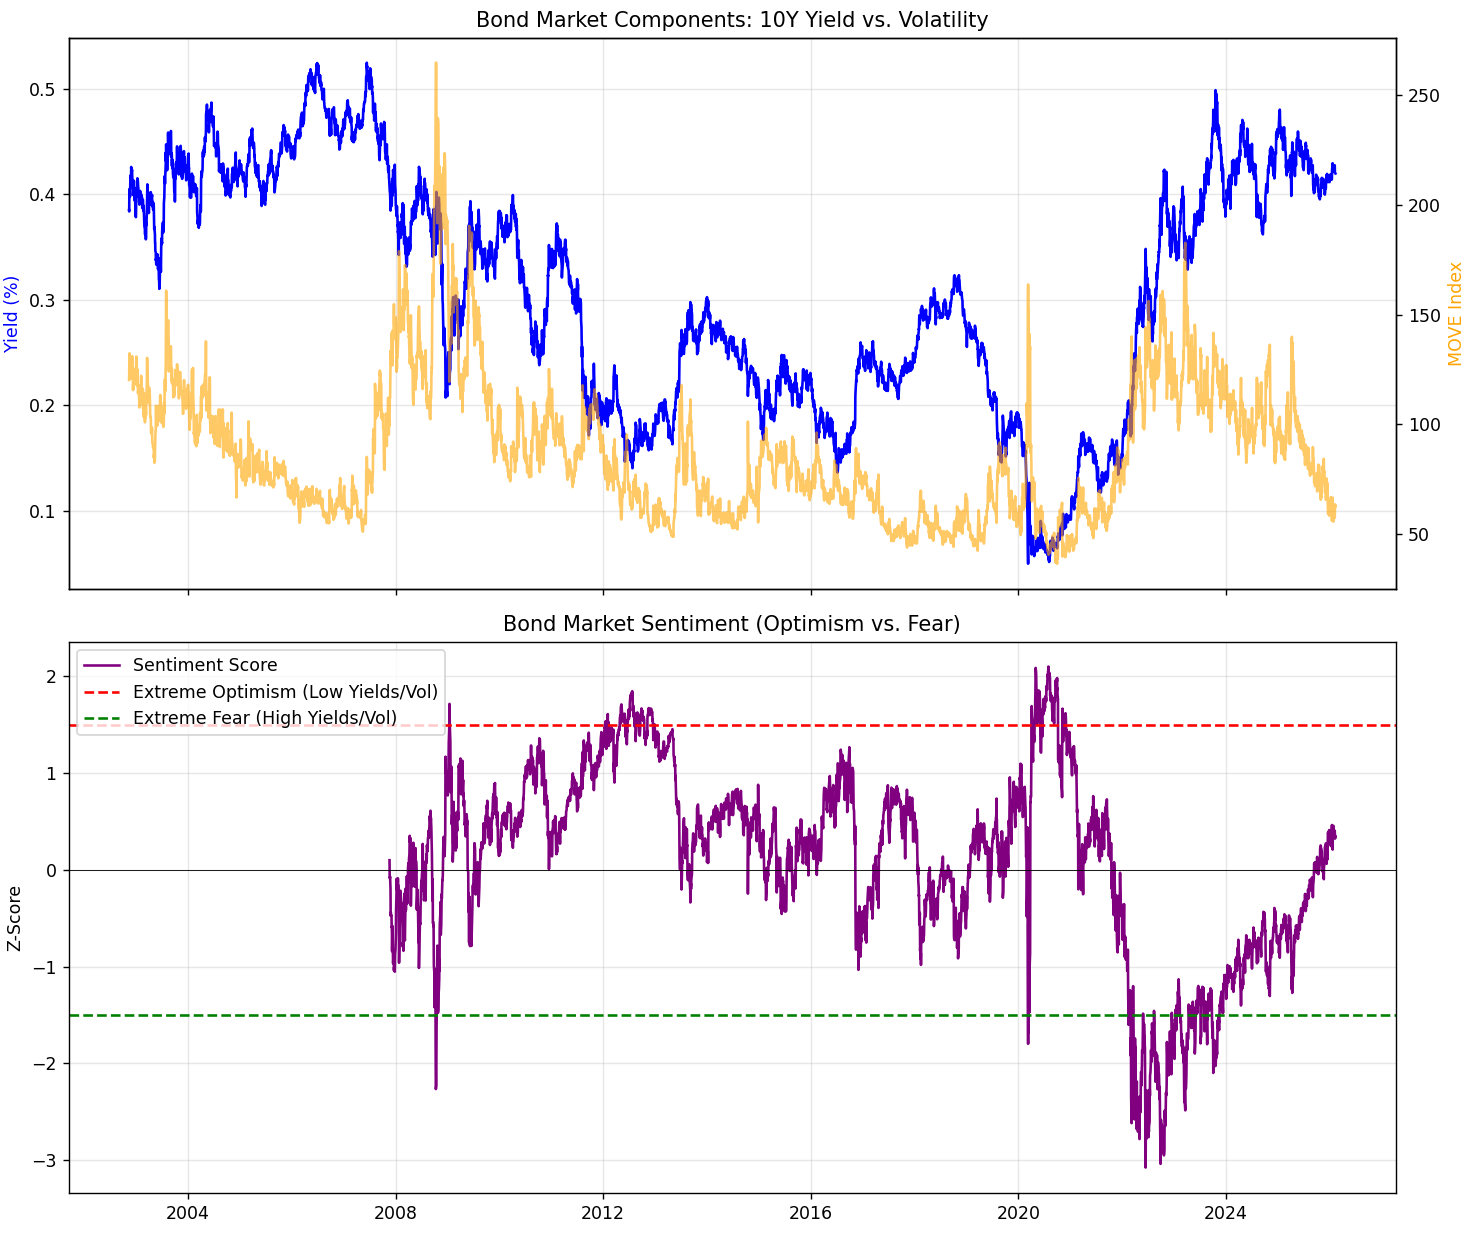
Source: Yale, Equitable Investors Aus 10 year bond yield relative to realised volatility; and Equitable Investors' Bond Market Sentiment indicator 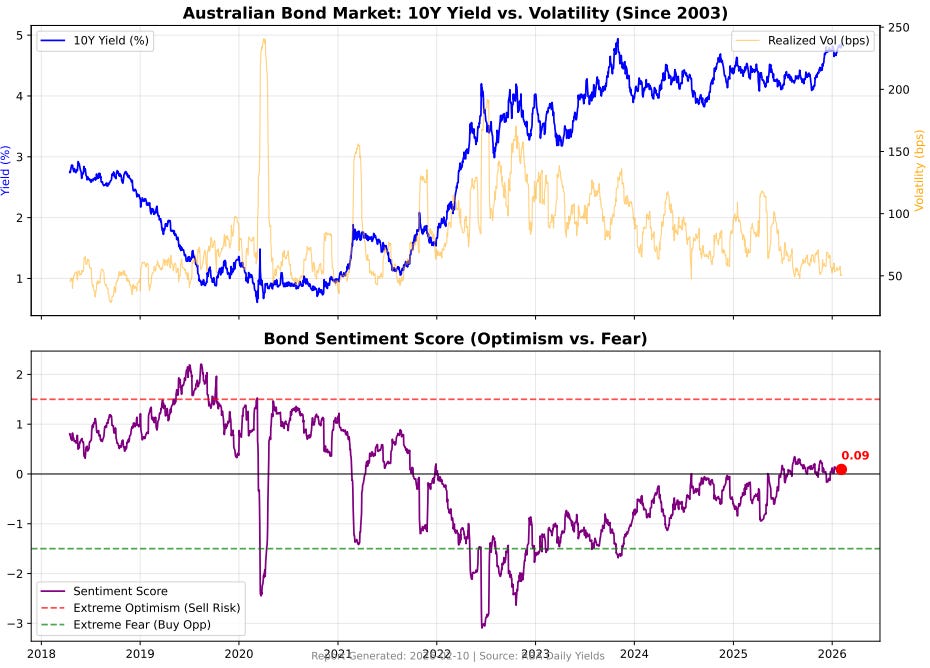
Source: RBA, Equitable Investors Largest weekly precentage falls for three S&P/ASX indices 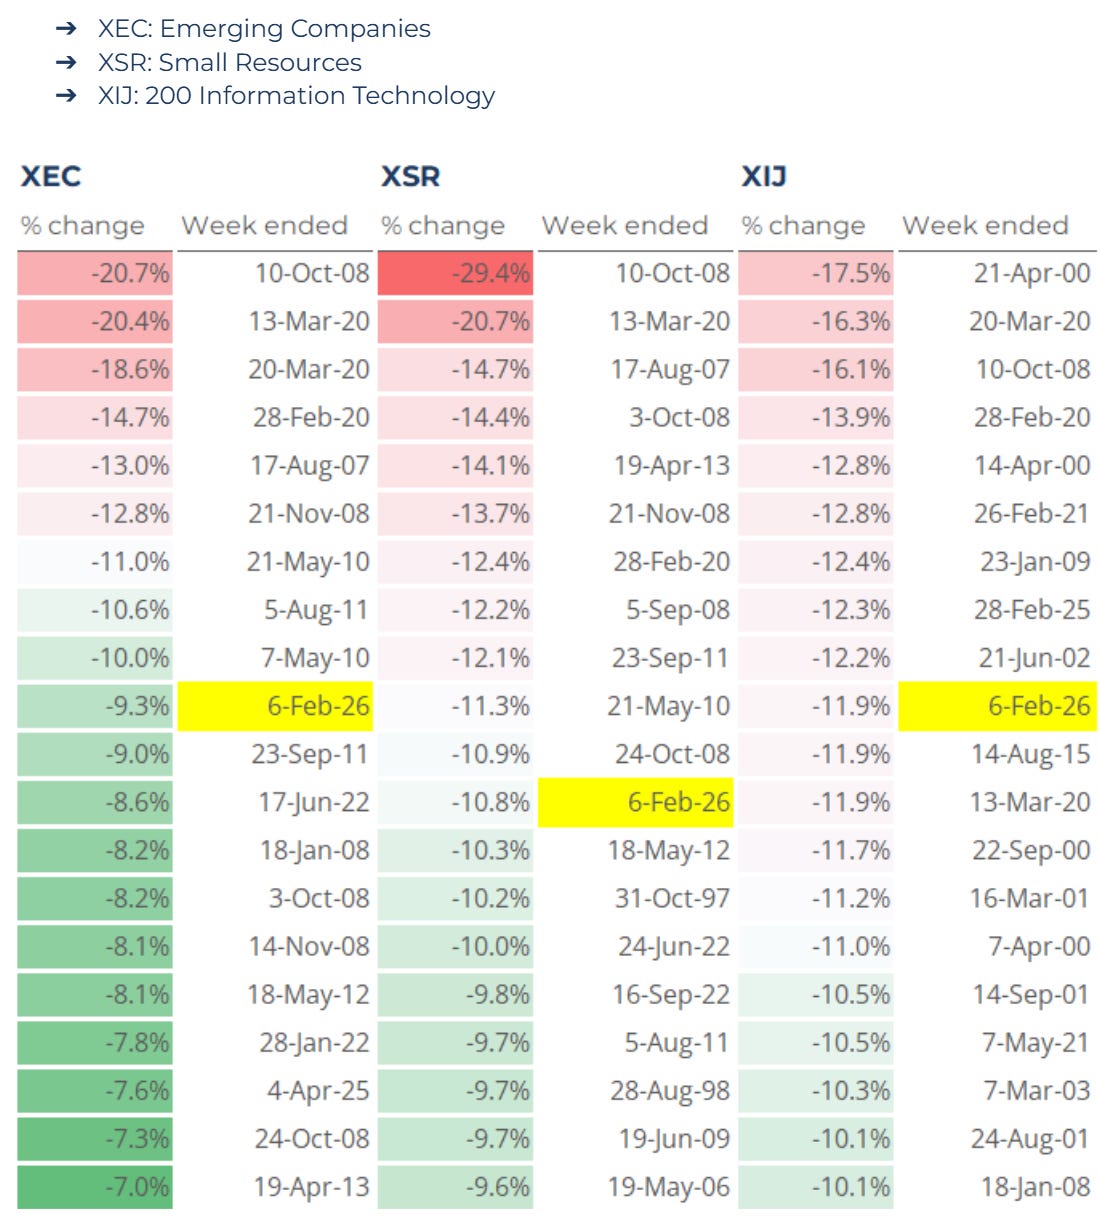
Source: Iress, Equitable Investors Impact on ASX small caps from factor shocks - implied by historical performance relative to proxy ETFs 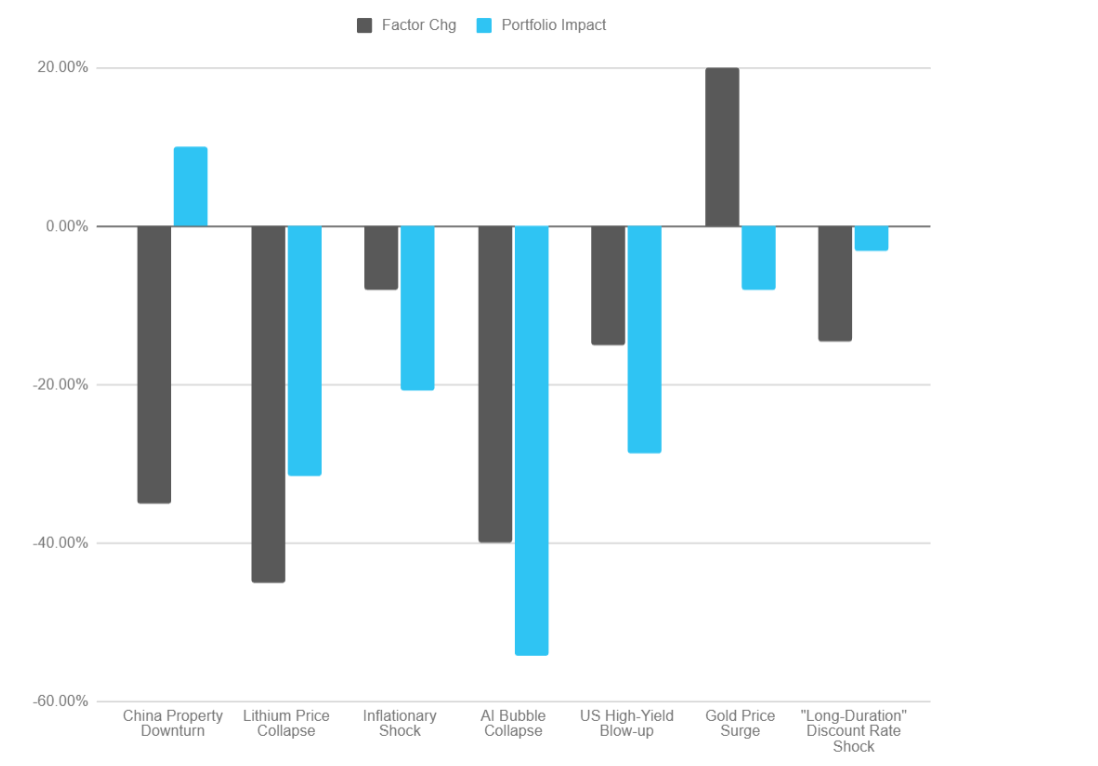
Source: Equitable Investors Recent pull-back in US tech EV/EBITDA multiples 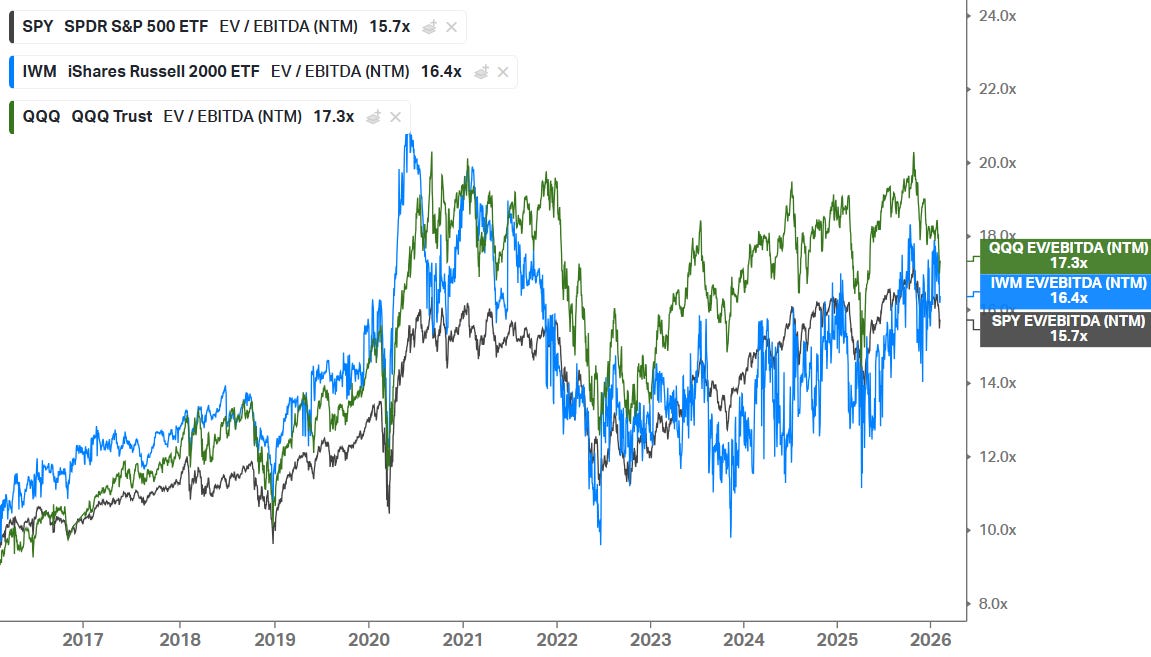
Source: Koyfin, Equitable Investors US Software sector median EV/Revenue multiple 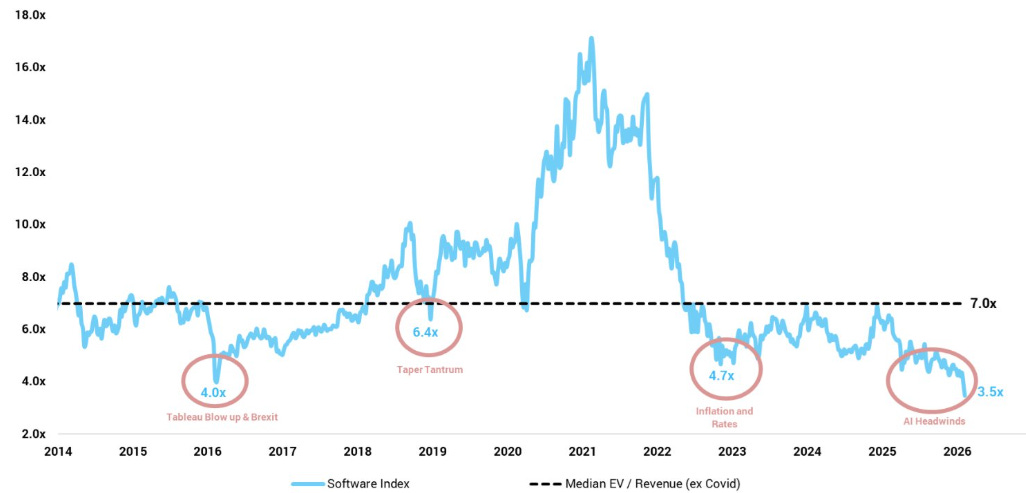
Source: Altimeter Surge in % of S&P 500 companies beating the index 
Source: Ned Davis Research via The Kobeissi Letter A regime shift with a surge in the percentage of stocks in the S&P/Small Ordinaries Index that outperformed the market cap weighted average return 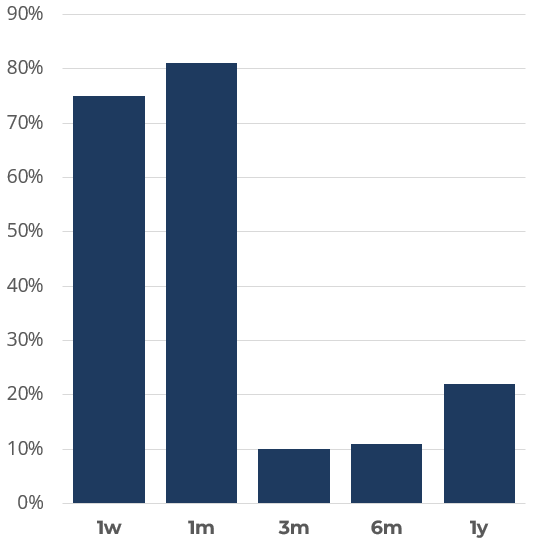
Source: Koyfin, Equitable Investors Dispersion of valuation multiples among US and Australian small caps 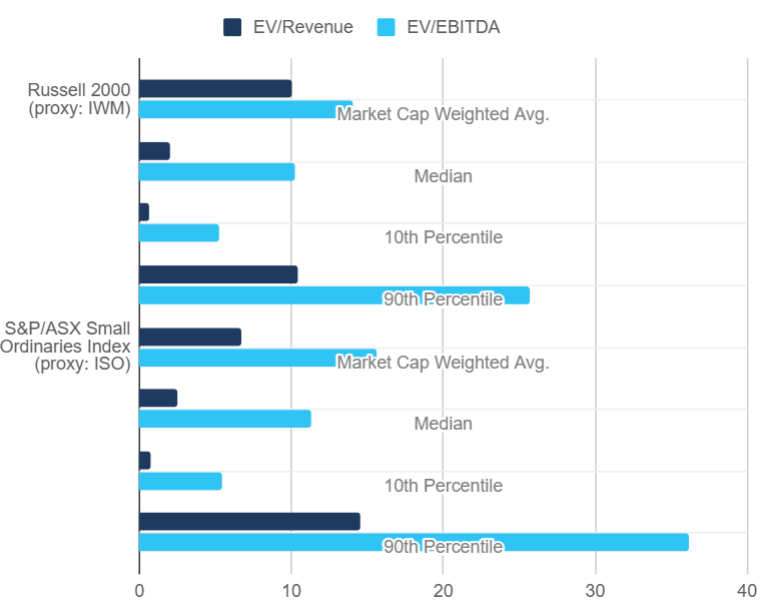
Source: Koyfin, Equitable Investors US Office CMBS delinquency rate spikes to record 12.3% 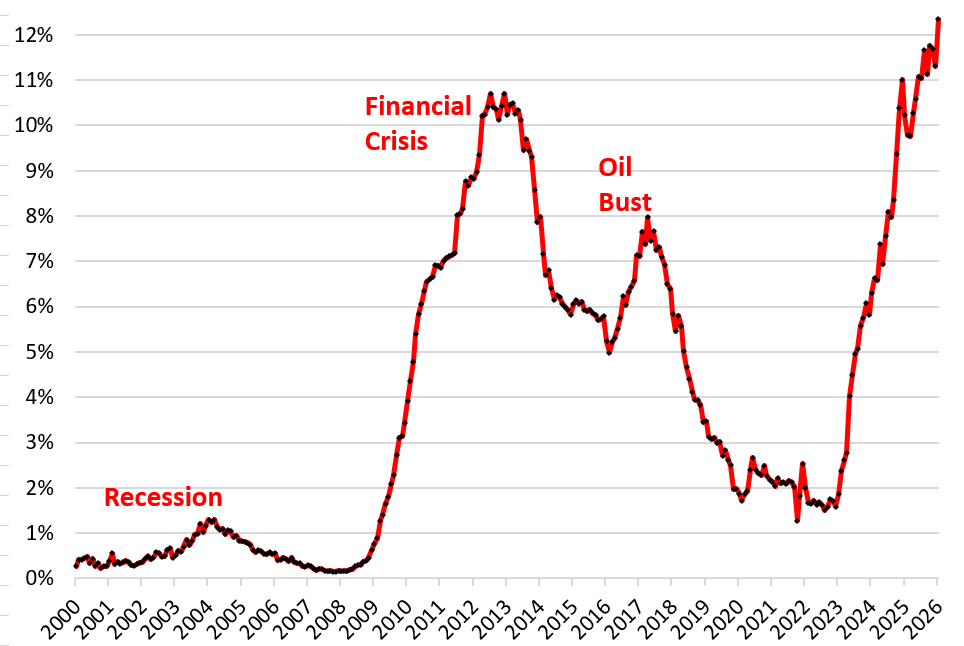
Source: Trepp via WOLFSTREET.com Funds operated by this manager: Equitable Investors Dragonfly Fund Disclaimer Past performance is not a reliable indicator of future performance. Fund returns are quoted net of all fees, expenses and accrued performance fees. Delivery of this report to a recipient should not be relied on as a representation that there has been no change since the preparation date in the affairs or financial condition of the Fund or the Trustee; or that the information contained in this report remains accurate or complete at any time after the preparation date. Equitable Investors Pty Ltd (EI) does not guarantee or make any representation or warranty as to the accuracy or completeness of the information in this report. To the extent permitted by law, EI disclaims all liability that may otherwise arise due to any information in this report being inaccurate or information being omitted. This report does not take into account the particular investment objectives, financial situation and needs of potential investors. Before making a decision to invest in the Fund the recipient should obtain professional advice. This report does not purport to contain all the information that the recipient may require to evaluate a possible investment in the Fund. The recipient should conduct their own independent analysis of the Fund and refer to the current Information Memorandum, which is available from EI. |

12 Feb 2026 - Australian and New Zealand Private Debt Market Quarterly Review
|
Australian and New Zealand Private Debt Market Quarterly Review Revolution Asset Management January 2026 (8-Minute Read) |
||||||||||||||||||||||||||||||||||||||||||||||||||||||||||||||||||||
|
Market overview The year 2025 ended with a continued constructive tone across all investment asset classes, with a 'risk-on' sentiment that was consistent for much of the year. Volatility was largely contained, punctuated only by a handful of brief dislocations - the most notable occurring during the Liberation Day tariff period. The broad-based rally has continued with record highs being tested in equities, precious metals, credit spreads and real estate valuations through the back end of 2025. In interest rate markets, there seems to be an emerging disconnect between the trajectory of the US versus other developed markets. In the US, inflation has yet to pick up and the economy continues to grapple with cost-of-living pressures. By contrast, the UK, Canada and Australia have all witnessed a significant uptick in inflation. This translates into potential interest rate cuts in the US (aided by US President Trump actively lobbying the US Fed) compared to other developed world central banks commencing or looking to hike interest rates to tame inflationary pressures. This backdrop has led to the weakening of the US dollar and the so-called 'de-dollarisation', as leading market commentators increasingly question the durability of the US dollar's status as the world's reserve currency. Closer to home, the RBA at the conclusion of 2025 signalled to the market that interest rate cuts previously factored in for 2026 were off the table, following a surprisingly high inflation reading of 3.8% in December. In fact, many economists were forced to backflip from their previous vocal rate cut calls to then predict multiple interest rate hikes this year. In the most recent January CPI monthly reading, inflation has moderated to 3.4% which has tempered rate hike expectations, with the market now predicting an almost certain 25 basis points (bps) rate hike by August 2026. The RBA ultimately has time to assess whether inflation will come into its target 2-3% band over the next few months, before having to make any decision to adjust the current cash rate of 3.6%. From Private Equity to Private Credit: A Market TransformationAs we enter the new year, it is worth reviewing the continued development of the private credit market globally. From humble beginnings, there has been nothing short of an explosion in private credit. According to Preqin, the private credit market has risen from US$250 billion in 2007 to a staggering US$2.5 trillion, globally. This phenomenon is best illustrated by the largest private equity firms, many of which now operate substantial private credit operations, often with more assets under management (AUM) in credit than in private equity. As an example, Apollo Global Management has a significantly larger private credit AUM of US$690 billion compared to its private equity AUM of US$150 billion. Ares Management, Blackstone, Brookfield, and KKR also share this trait, having substantial private credit businesses that rival or exceed their private equity AUM, as shown in the chart below. These once celebrated and successful private equity managers have effectively morphed into major private credit firms. The principal reason for this has been the attraction of a more conservative asset class, where scale allows these firms to underwrite and hold whole loans that would have previously been financed by banks or the broadly-syndicated loan/CLO markets. The Largest Private Equity Firms Have Become Major Private Credit Players
Source: Gain.pro and public filings. Analysis excludes infrastructure and real estate funds but includes secondaries. As the private credit market continues to mature, it is fair to say that there has been a permanent shift away from banks being traditional lenders to companies �' from middle market size all the way through to the very largest privately owned corporates. At the same time, there has been an absence of a meaningful recession (negative COVID-related impacts were short-lived thanks to co-ordinated fiscal and monetary policy stimulus) which has supported consistently robust returns in private credit, with little dispersion between top and bottom quartile managers. This has fuelled the growth in both fundraising and deployment by the large as well as smaller credit managers in the sector. As Private Credit Grows, Loan Protections ErodeWhile the overall trajectory of the private credit market has been positive, there have been some unwelcome signs that there may be cracks emerging. The rapid pace of fundraising in a prolonged, benign, 'risk-on' environment has created mounting pressure to deploy capital. This has led to weakening terms and conditions of new private credit loans, as demonstrated by the increasing prevalence of covenant-lite loans in both broadly syndicated loans and private credit markets. Since 2011, the share of covenant-lite loans has risen dramatically. In the US private credit market, they accounted for around 15% of broadly syndicated loans in 2011, climbing to over 90% by 2023. Covenant-lite loans offer fewer financial restrictions and protective covenants for lenders than typical loan agreements, reducing safeguards in the event of borrower stress. In addition, over the past two years, covenant-lite issuance has become commonplace, especially in larger deals exceeding US$500 million. Furthermore, high-profile defaulted and fraudulent loans to companies such as First Brands and Tricolor have highlighted a lack of thorough due diligence and weakened credit underwriting standards that has led to multi-billion-dollar losses to private credit lenders. These cases provide additional evidence of the pressures to deploy capital and the intensifying competition within the market. While these trends are US specific, similar dynamics are emerging in Australia. Many larger private credit funds have grown comfortable with weaker terms, conditions, and documentation, drawing on their experience in international markets. This has intensified competition for larger leveraged buy-out loans, often with terms that benefit borrowers at the expense of traditional lender protections. Another feature which we have witnessed in the larger international funds is their more recent adoption of asset backed securities (ABS) or asset backed finance as a complement to their leveraged finance focus. This is principally due to ABS transactions having a much more prescriptive treatment of cashflows and stringent performance triggers that are embedded in comprehensive documentation as well as better margins for the risk. As such, there has been greater competition in the areas in which Revolution looks to deploy capital. Commitment to Credit Quality and Investor TransparencyIn today's environment of heightened competition and weaker loan terms, maintaining rigorous credit discipline is more critical than ever. Revolution has been able to maintain a high level of capital deployment and at the same time maintain high levels of credit quality principally due to the firms scale and target yield. Although operating on a smaller scale than the global private credit giants with Australian operations, Revolution has established a leading position in Australia and New Zealand by being able to provide in excess of A$200 million per transaction for loans that are priced with credit margins between 400 bps and 600 bps. In an environment where credit underwriting standards and documentation have weakened, Revolution remains focussed on thorough due diligence of each loan and maintains very strict quality standards. This discipline is evidenced by avoiding payment-in-kind (PIK) loans, cyclical exposures, lending to small or start-up counterparties, and entering into loans with very weak lender protections. In more recent portfolio transactions, Revolution has been able to take a cornerstone lender role through shaping key terms and conditions, as well as demand superior economics more akin to underwriting fees than syndication fees. In our last quarterly report, we discussed the findings of the two ASIC reports of the Australian private credit sector and outlined Revolution's response. The key findings of these reports �' covering areas such as treatment of upfront fees, independent portfolio valuations, avoidance of related-party transactions, and transparency on underlying loan portfolios - align closely with Revolution's existing practices. We are continually looking at ways to improve and remain committed to transparency and prompt responsiveness to ASIC's recommendations. Business Update: Strategic Partnership, New Products and Team GrowthDuring the quarter, it was announced that Revolution agreed to form a strategic partnership with ColCap Financial Group (ColCap) by selling a 14% stake in the firm to ColCap. ColCap is a leading non-bank originator of Australian mortgages with over a 20-year track record in originating and servicing these loans with an exemplary track record. The nature of the strategic partnership with ColCap will allow Revolution to bring two new products to market throughout the course of 2026. We look forward to presenting these products to our investors in due course. We are pleased to announce the addition of two new members to the Revolution team. John Price joined the firm at the end of 2025 in the newly created role of Head of Strategy and Distribution. John is a seasoned professional with over 20 years' experience in financial markets. He will be responsible for working with the Channel Capital distribution team in servicing existing clients, assist with capital raising, and contribute to the development and launch of new and innovative products in 2026 following the strategic partnership with ColCap. In addition, Christian Burrello joins as an Investment Analyst and will work closely with the investment team responsible for the senior secured corporate loans and real estate loans in the portfolio. We are proud to welcome the new members of the team in line with the firm's growth. Portfolio and pipeline reviewThe Revolution Private Debt Fund II (the Master Fund) has returned 0.67% (after fees)* in December and is meeting its target return of the RBA cash rate plus 4% to 5% p.a. (net of fees and expenses) since inception.** The objective of the Master Fund is to achieve this return with low volatility and with the benefit of having security over the underlying assets. The Master Fund has a total fund size of A$3.06 billion as at 31 December 2025. The Master Fund held a total of 57 loans as at 31 December 2025, with an average expected life of the portfolio being 1.9 years. The portfolio yield to maturity is 8.84%, with a credit spread of the portfolio above BBSW of 493 bps. The average credit rating of the portfolio is BB. The deal pipeline in Australia and New Zealand remains robust, which should allow for continued strong deployment. In Senior Secured Corporate Loans, activity has increased in the second half of the year as was expected earlier in the year. The Asset Backed Securities market remains active. Revolution has been focused on upsizing many of its existing private warehouse investments as the size of facilities and the Fund's appetite grows in tandem while investing in new warehouses from well capitalised preferred originators. Additionally, Revolution continues to find and capitalise on attractive secondary market opportunities across sectors. Source: Revolution Asset Management. See below for defined terms. Revolution Private Debt Fund II (CHN3796AU)*
* Performance is based on month end unit prices before tax. Net performance (after fees) is calculated after management fees and operating costs. Individual Investor level taxes are not taken into account when calculating returns. This is historical performance data. It should be noted the value of an investment can rise and fall and past performance is not indicative of future performance. The comparison to the RBA Cash Rate is displayed as a reference to the target return for the Master Fund and is not intended to compare an investment in the Master Fund to a cash holding. Loans held by the Master Fund are subject to borrower default risk and as such the Master Fund is of higher risk than an investment in cash. Portfolio characteristics as at 31 December 2025
Source: Revolution Asset Management. See below for defined terms. These 'forward-looking statements' are not guarantees or predictions of future performance, and involve known and unknown risks, uncertainties and other factors, many of which are beyond our control, and which may cause actual results to differ materially from those expressed. Although we believe that the Fund's anticipated future results, performance or achievements expressed or implied by those forward-looking statements are based upon reasonable assumptions and expectations, the reader should not place undue reliance on forward-looking statements. |
||||||||||||||||||||||||||||||||||||||||||||||||||||||||||||||||||||
|
Funds operated by this manager: Revolution Private Debt Fund II , Revolution Wholesale Private Debt Fund II - Class B This material has been prepared by Alphinity Investment Management ABN 12 140 833 709 AFSL 356 895 (Alphinity). It is general information only and is not intended to provide you with financial advice or take into account your objectives, financial situation or needs. To the extent permitted by law, no liability is accepted for any loss or damage as a result of any reliance on this information. Any projections are based on assumptions which we believe are reasonable but are subject to change and should not be relied upon. Past performance is not a reliable indicator of future performance. Neither any particular rate of return nor capital invested are guaranteed. |

11 Feb 2026 - Global Equity Outlook 2026: Earnings, Expansion, Excellence
|
Global Equity Outlook 2026: Earnings, Expansion, Excellence Alphinity Investment Management January 2026 3 minutes read time |
|
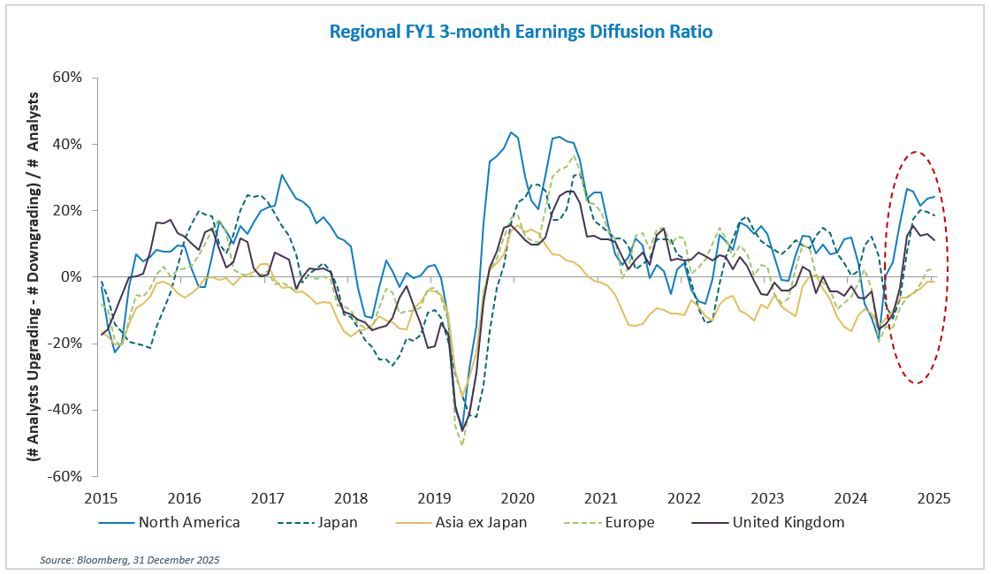
As we enter 2026, global equity markets are poised for the next phase of expansion. After a year defined by policy disruption, technological revolution, and geopolitical uncertainty, investors are rightly questioning whether the narrow leadership and momentum-driven returns of recent years can continue. Our view is that 2026 represents an evolution in market dynamics: from surviving tension to capitalising on expansion, from chasing narratives to backing earnings, and from speculative fervour to quality compounding. If 2025 was the year of "Tariffs, Tech, and Tension," we believe 2026 will be remembered as the year of "Earnings, Expansion, and Excellence. Reflecting on 2025: Tariffs, Tech, Tension Judging by the opening weeks of 2026, elements of these three T's appear determined to follow us into the new year. Investors should remember last year's lesson: even in strong years, significant volatility is inevitable. The key is maintaining discipline through the swings rather than reacting to them. EARNINGS: A Constructive Global Cycle Broadens Earnings sentiment (diffusion ratio) at a 4-year high with a positive inflection across major regions
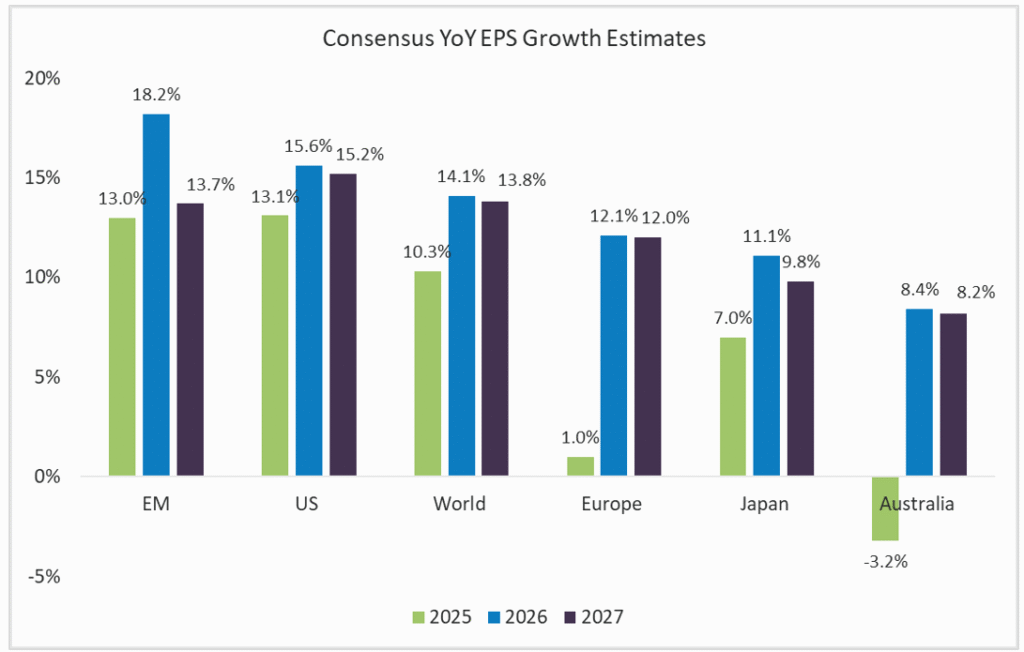
Source: Alphinity, Bloomberg, 31 December 2025 Technology and Financials continue to lead earnings growth revisions, though they have recently been joined by Materials as higher commodity prices flow through to corporate results. Healthcare, Industrials, and Consumer sectors still lag but are showing signs of stabilisation. Consensus now expects the MSCI World index to deliver healthy double-digit EPS growth of approximately 14.1% in 2026 and 13.8% in 2027. Most major markets are projected to see a rebound in earnings growth over this period, with current laggards like China and Europe positioned to catch up. This broadening earnings picture supports higher equity valuations and reduces the concentration risk that has concerned many investors. Early signs from the 4Q25 reporting season suggest the earnings trajectory remains strong, though market reactions are more subdued as elevated valuations raise the bar for positive surprises. If companies deliver the usual 4-5% beat, this will mark a fifth straight quarter of double-digit earnings growth--a streak not seen since late 2018. Consensus expects strong earnings growth across all key regions in 2026 and 2027
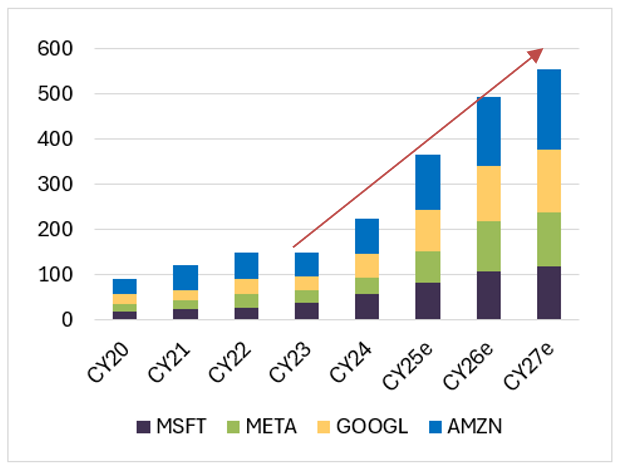
Source: Bloomberg, 12 January 2026 We remain relatively constructive on the outlook for corporate earnings in 2026, which we expect to be supported by generally favourable macroeconomic conditions. Importantly, these supportive conditions are not dependent on a single driver but reflect expansion across multiple fronts. EXPANSION: Multiple Tailwinds Converge
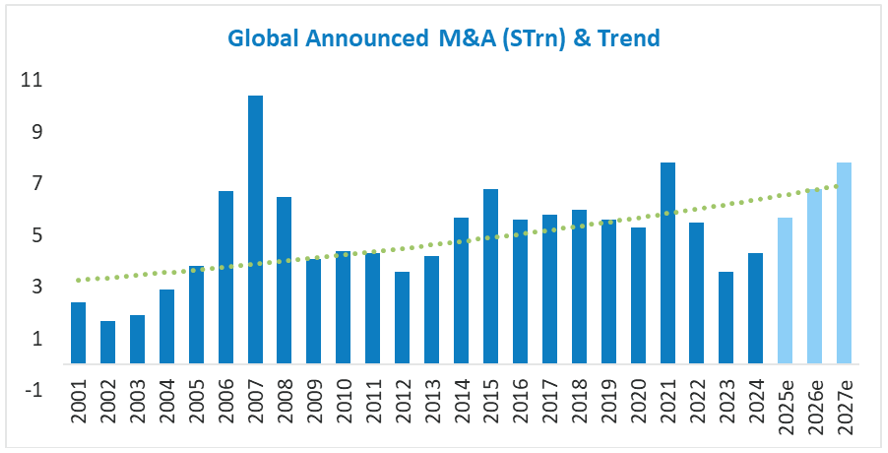
Source: Alphinity, Factset, 31 December 2025 Consumer fundamentals remain surprisingly robust despite increasing bifurcation. Unemployment sits near historic lows across developed markets, real wage growth persists, and household balance sheets are healthy following pandemic-era deleveraging. The emerging K-shaped pattern--with upper-income households benefiting from wealth effects while lower-income consumers face pressure--creates divergent retail dynamics but hasn't derailed aggregate spending. With consumption representing 70% of US GDP, this resilience provides a critical foundation for corporate earnings. Mergers and acquisitions rebounded sharply in 2025 after hitting 20-year lows in 2023. The catalysts driving this resurgence, lower rates, open capital markets, improving corporate confidence, and more favourable regulation, remain firmly in place. Companies are no longer waiting on the sidelines as they pursue growth and technology capabilities through strategic transactions. Deal activity is forecasted to reach $6.8 trillion in 2026 and $7.8 trillion in 2027*, supported by private markets industry sitting on $4.2 trillion of dry powder (approximately $8 trillion of buying power with leverage), the stage is set for sustained M&A momentum. Across our portfolios, serial acquirers like Amphenol, Parker Hannifin, Motorola Solutions, and CRH continued adding value through disciplined consolidation strategies, while investment banks JPMorgan and Morgan Stanley benefit from elevated advisory and underwriting activity.
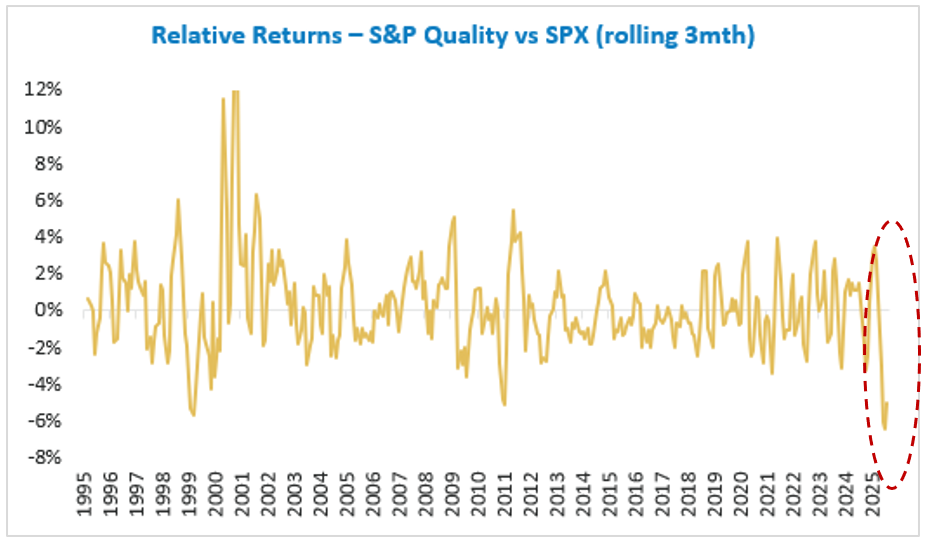
Source: *Morgan Stanley Research, Dealogic, 31 December 2025 EXCELLENCE: Quality's Overdue Mean Reversion Sector dynamics compounded the challenge. Quality indices traditionally overweight Consumer Staples and Healthcare--both facing significant idiosyncratic headwinds--while underweighting Banks, which strongly outperformed. Elevated valuations, particularly in Europe, and speculative retail activity added further pressure. AI disruption concerns also weighed on Software, Diversified Financials, and Business Services, all typical quality portfolio constituents. However, conditions now favour mean reversion. Relative valuations between quality and lower-quality stocks have normalized. Sector-specific headwinds are easing. Most importantly, as geopolitical and policy volatility persists, investors are increasingly valuing downside protection. Quality companies--those with sustainable competitive advantages, pricing power, and capable management teams with proven capital allocation track records--are better positioned to navigate uncertainty and deliver consistent returns. In an environment where fundamental differentiation matters again, excellence in business quality should separate winners from pretenders. Quality as a factor had its worst year in decades during 2025
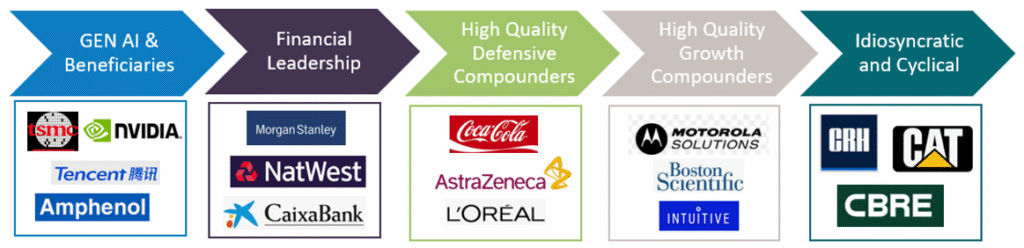
Source: S&P, 31 December 2025 Positioning for 2026 AI and Technology: We maintain selective exposure across the value chain, balancing opportunity with execution risk. Our Magnificent Seven exposure include Nvidia and Microsoft for their AI leadership and supportive valuations. Beyond mega-cap tech, TSMC offers dominant semiconductor positioning with fortress balance sheet strength, Tencent combines gaming and cloud growth with exceptional cash generation, and Amphenol provides mission-critical connectivity solutions with high switching costs. We remain thoughtful about position sizes given the technology's rapid evolution, uncertain ROI timelines for hyperscalers, and disruption risks to incumbent business models. Financials: Global banks represent our primary cyclical exposure, benefiting from sustained net interest margins, robust capital return programs, and improving loan growth. JPMorgan and Morgan Stanley provide diversified financial services leadership, while NatWest and Caixa Bank offer compelling regional banking franchises in the UK and Spain respectively. Healthcare, Industrials, and Quality Defensives: Boston Scientific and AstraZeneca deliver healthcare exposure through innovation pipelines and R&D productivity. Caterpillar captures industrial recovery with pricing power and durable service revenue. Defensive positions in Coca Cola and L'Oreal (Consumer Staples) offer global scale and solid organic growth. Cyclicals such as CBRE (Real Estate) and CRH (Materials) provide quality characteristics and established competitive moats. This positioning reflects our conviction that 2026 favours portfolios combining secular growth exposure with business quality--companies that can compound earnings through volatility rather than merely benefit from beta. A diversified portfolio of earnings leaders
Source: Alphinity, 31 December 2025 *Select portfolio holdings. Conclusion The "free money" period for low-quality momentum plays appears to be ending. While volatility and policy uncertainty will undoubtedly persist, portfolios that combine exposure to secular growth trends with an emphasis on earnings certainty, balance sheet strength, and management excellence are well-positioned to deliver superior risk-adjusted returns. For investors willing to look beyond the narrow leadership that dominated recent years, 2026 offers compelling opportunities across a broadening set of quality businesses with genuine earnings power. |
|
Funds operated by this manager: Alphinity Australian Share Fund , Alphinity Concentrated Australian Share Fund , Alphinity Sustainable Share Fund , Alphinity Global Equity Fund , Alphinity Global Sustainable Equity Fund This material has been prepared by Alphinity Investment Management ABN 12 140 833 709 AFSL 356 895 (Alphinity). It is general information only and is not intended to provide you with financial advice or take into account your objectives, financial situation or needs. To the extent permitted by law, no liability is accepted for any loss or damage as a result of any reliance on this information. Any projections are based on assumptions which we believe are reasonable but are subject to change and should not be relied upon. Past performance is not a reliable indicator of future performance. Neither any particular rate of return nor capital invested are guaranteed. |

9 Feb 2026 - Australian Secure Capital Fund - Market Update
|
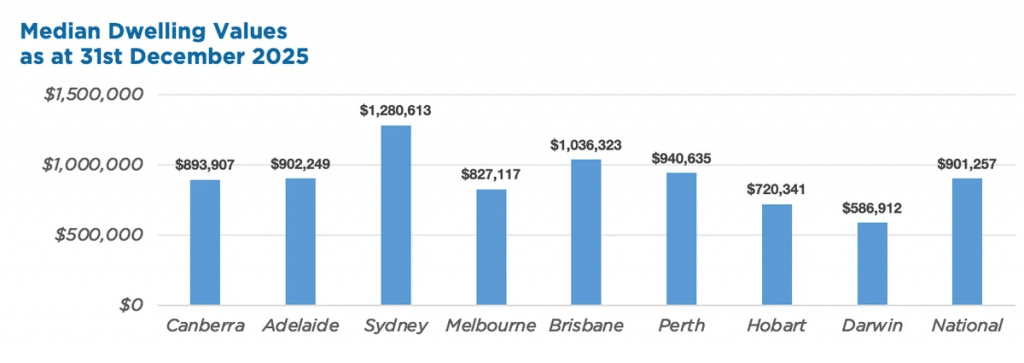
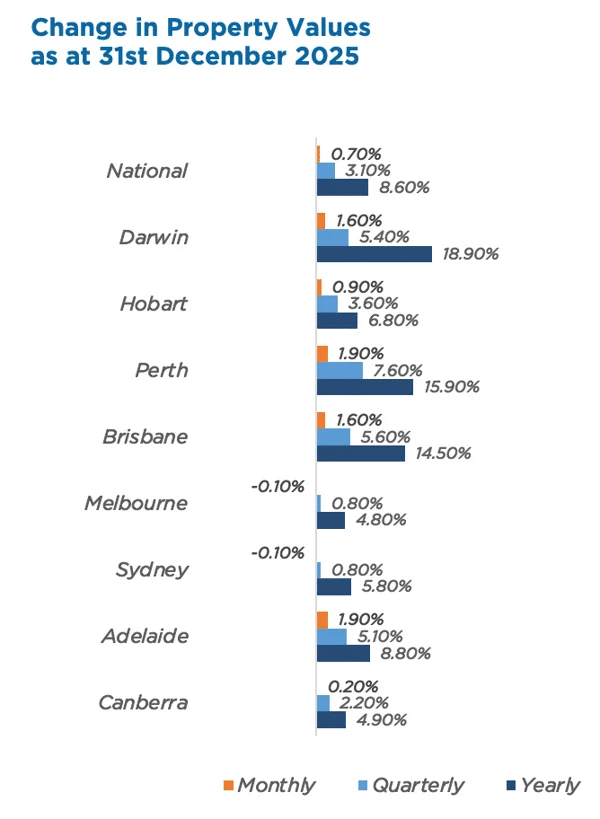
Australian Secure Capital Fund - Market Update Australian Secure Capital Fund January 2026 December saw the smallest national pricing gain in five months, rising by just 0.7%. Values in Melbourne and Sydney declining by 0.1% dragged this figure down. In contrast, Brisbane, Adelaide, Perth, and Darwin all saw increases of 1.6% or higher. More broadly, the Australian housing market finished 2025 strongly, with the national median dwelling value surging 8.6% over the year--the most since 2021. Regional markets outperformed capital cities with a 9.7% annual rise, compared to 8.2% for the capitals. In 2026, while economic uncertainty and affordability may temper the pace of growth, a persistent shortage of new housing supply should act as a floor for property values, protecting against significant price drops.
 January Edition Funds operated by this manager: ASCF Select Income Fund , ASCF High Yield Fund , ASCF Premium Capital Fund , ASCF Private Fund
|

6 Feb 2026 - 2026: A Year of Calm Before the Market Storm?
|
2026: A Year of Calm Before the Market Storm? JCB Jamieson Coote Bonds January 2026 (3-minute read) Top of mind this summer, more so than any other recent summer, is the extent to which the recent remarkable streak of performance across almost all asset classes powers ahead, or loses momentum. As we enter 2026, markets are tinder-dry with risk, and for now the winds are calm. Since last month, global markets have seemingly settled into a tranquil yet uneasy holding pattern, having made considerable progress to date in navigating the turbulence presented by tariffs, policy uncertainty, geopolitical travails, and stagflation. What might occur in the year ahead to potentially ignite a sparkcould it be another policy surprise from the U.S. Administration, geopolitical tensions, or macroeconomic developments? Let's map out and break down the key risks that might cast a long shadow over current pricing in global markets. In the U.S., markets appear to be much less responsive than usual to surprises in economic data after the U.S. Federal Government shutdown late last year. This stands to reason the U.S. Administration has challenged the independence of not only the U.S. Federal Reserve, but ostensibly also the civil servants at the Bureau of Labor Statistics and the Bureau of Economic Activity who produce the data releases. Some believe, and there is very little evidence that contradicts their view, that President Trump intends to do what he sees as necessary to frame the macro outlook and asset price dynamics in the best possible light for the Grand Old Party ahead of this year's midterm elections. In China, authorities have held back on announcing significant fiscal stimulus, instead preferring to outmaneuver the U.S. on trade and foreign policy, particularly with respect to rare earths supply. All the while President Xi has tirelessly advanced China's economic and strategic interests, most recently allowing the renminbi to reach its strongest level against the U.S. dollar in the past several years, and applying ever-increasing pressure on Taiwan's independence (given its semiconductor fabrication infrastructure after the U.S. set a dangerous precedent in Venezuela, which has the world's largest oil reserves). In Japan, Prime Minister Sanae Takaichi has just called snap elections in an effort to shore up support for planned fiscal stimulus and policy support intended to ease the cost of living. However, she must also contend with a lack of macro policy coordination with yen weakness; a reticence from the Bank of Japan to continue tightening policy and preserve its "virtuous cycle" between activity, wages and prices; and ceaselessly rising Japanese government bond yields. This is a potent combination that also indirectly led to the downfall of the Prime Minister's predecessor, Shigeru Ishiba. And these thematic patterns are repeated in kind throughout Europe, Canada and the UK: unsteady political leadership, complex macro and broader policy challenges, and the fragmentation of the regional and international order via superficial cooperation amid divergent national interests. All the while, risk assets are priced for continuing material gains, and valuations are stretched to record levels, whilst central banks globally are making marginal adjustments to gradually recalibrate policy towards the elusive, ever-shifting mirage of neutrality loosening here, tightening there all second order given the macro backdrop described above. When could valuations adjust and risk potentially be adjusted or even repriced? It is the critical question we are all focused on this year in global markets. Pricing may well continue its onward march higher this year, but after a period of such impressive asset market performance, history would suggest the largest gains are behind us. Coupled with the possibility of complacency amongst market participants who have become accustomed to outsized gains in recent times, this sets the stage for an interesting and eventful year ahead and does create opportunities for those prepared to question the current consensus that underpins market pricing. Funds operated by this manager: CC Jamieson Coote Bonds Active Bond Fund (Class A) , CC Jamieson Coote Bonds Dynamic Alpha Fund |

5 Feb 2026 - Expert Analysis of the RBA's February 03 Rate Decision
|
Expert Analysis of the RBA's February 03 Rate Decision FundMonitors.com February 2026 |
|
Chris Gosselin, CEO of FundMonitors.com, speaks with Nicholas Chaplin, Director and Portfolio Manager at Seed Funds Management, and Renny Ellis, Director & Head of Portfolio Management at Arculus Funds Management. The discussion examines the Reserve Bank of Australia's latest rate hike, with both guests arguing the RBA misjudged conditions by cutting rates last year and is now reacting too heavily to short-term data. They highlight the role of policy lags, the strengthening Australian dollar, and bond market signals, warning that further tightening risks overshooting and undermining economic stability. |

5 Feb 2026 - Emerging markets outlook (and drinking tea) in 2026
|
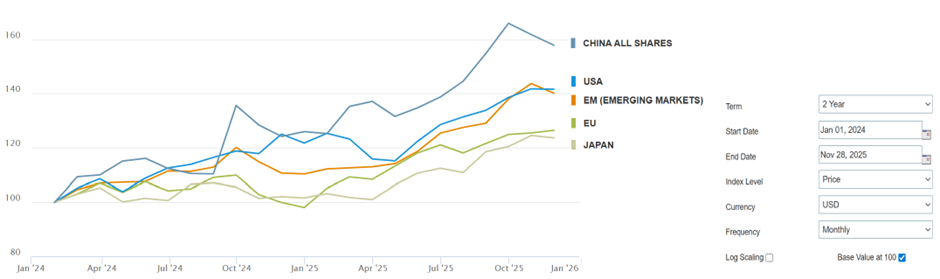
2025 EM Outlook: Reading the tea leaves Ox Capital (Fidante Partners) January 2026 (15-minute read) Investing is like boiling a kettle. When the kettle is hot, one can get burnt. In the investing world, it doesn't always pay to chase what is hot. When an economy is running hot, central banks will need to hike interest rates to ensure inflation stays under control. When an investment theme is "hot", its future potential is rapidly priced in by investors. In comparison, when the kettle is warming up, one has time to set up the tea set, watch the kettle boil, take a moment to brew the tea to hit its full flavour, and finally sit back and enjoy. EM equities have been "cold" for over a decade, but the kettle is finally warming up. Between Jan-24 and Nov-25, EM equities performed just as well as US equities. In particular, the Chinese equity market, which was considered "uninvestible" by some funds, has outperformed the US, Europe, and Japan markets over the same period. Figure 1: Chinese equity performance overtook key DMs in 2025
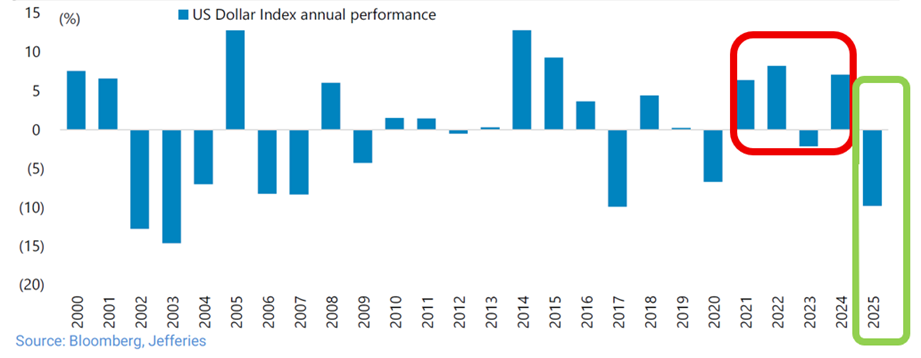
Source: MSCI.Developed markets have been running too "hot" In 2026, the "hot" developed markets (DMs) will have their share of challenges. Many developed economies have been running "hot" for some years propelled mostly by debt accumulation and rising asset prices. Since the pandemic, most developed economies have added debt to fund deficit spending for the maintenance of living standards. Politicians have often picked the easy option of further spending rather than reining in budget deficits. Global markets are starting to contemplate these latent risks. The weakening US dollar (USD), surging gold prices, and rising bond yields in the US and Japan (now over 3% for 30-year Japanese Government Bonds) are perhaps foretelling the problems ahead. Figure 2: USD weakening of 2025
Source: Bloomberg, Jefferies.
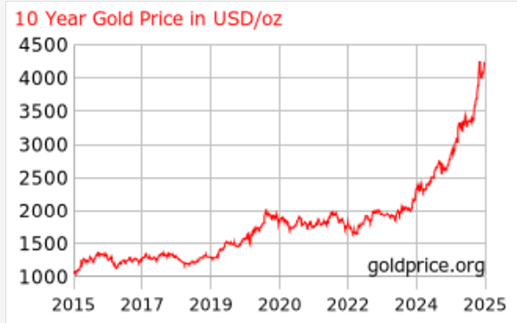
Figure 3: The gold price has rallied nearly 60% YTD at time of writing
Source: Goldprice.org.
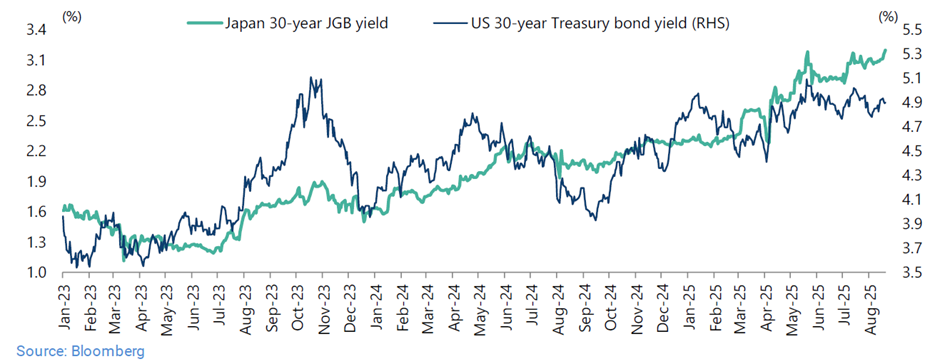
Figure 4: Rising 30-year bond yields in the US and Japan
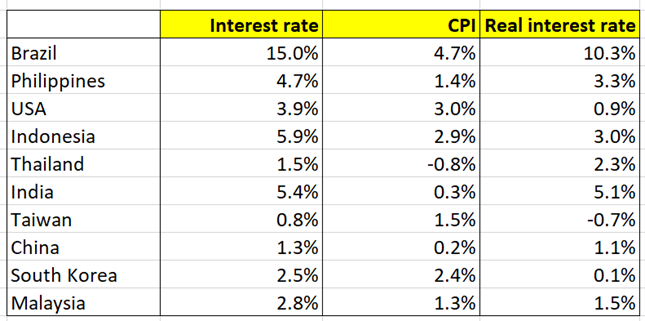
Source: Bloomberg.A changing geopolitical landscape and global alliances deepen the challenge ahead, as countries are also compelled to fund new defence spending. To fund this ever-growing government debt, it is likely that major DM central banks will loosen monetary policy (i.e. cut rates or even pursue QE in some form) in the face of moderately high inflation rates. Emerging markets are only "warming up" in 2025EM countries have better economic and demographic foundations than most of the developed world. Most EM governments have managed their finances responsibly. Consider Malaysia, which is actively pursuing fiscal reform, and Indonesia, which under President Joko Widodo has improved in leaps and bounds. Meanwhile, the Chinese and Vietnamese governments have both made tough decisions to keep their property markets in check. Having learnt their lessons from previous debt crisis, EM governments have worked hard to keep fiscal deficits under control, while still pursuing effective pro-development agendas. Even through COVID, they refrained from large government handouts. EM central banks broadly have no hesitation pushing interest rates higher to support domestic currencies and keep inflation in check where needed, even as many of the DM central banks' have begun new easing cycles. Case in point in monetary policy responsibility is Brazil, where the central bank has kept interest rates at 15% despite inflation running at a much lower 4-5%! As governments remain sensible in EM, many countries in EM have reasonable real interest rates (>3%). That is, there can be more monetary policy easing to come, supporting economic growth and equity markets in many EMs. Figure 5: Brazil, Indonesia, Philippines and India have high real rates of over 3%
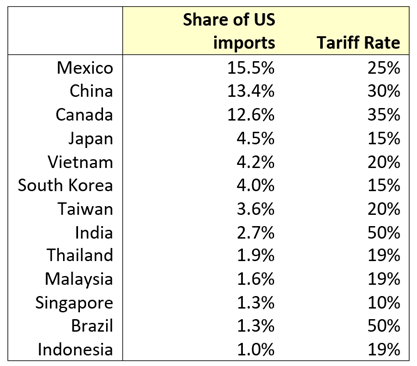
Source: Trading Economics.2025 can be best characterised as a year of "de-risking" across EM. By and large, EM economies have emerged unscathed from US tariff negotiations. The final tariffs were largely between 10-20% in Asia, much lower than the initial "targets". This left the relative competitiveness of these Asian EM export nations unscathed. Two EM countries which were singled out by the US were Brazil and India. However, exports to the US from India and Brazil only account for a small percentage of GDP (≈2%), and likely any loss in volumes from the US can be taken up by other trading partners. Finally, China and the US agreed to a trade truce in November 2025, meaning trade and key external risks are settled for now, and we expect this to remain at least through 2026. Figure 6: Key Asian nations we invest in remain highly competitive exporters, despite new tariffs imposed by the US
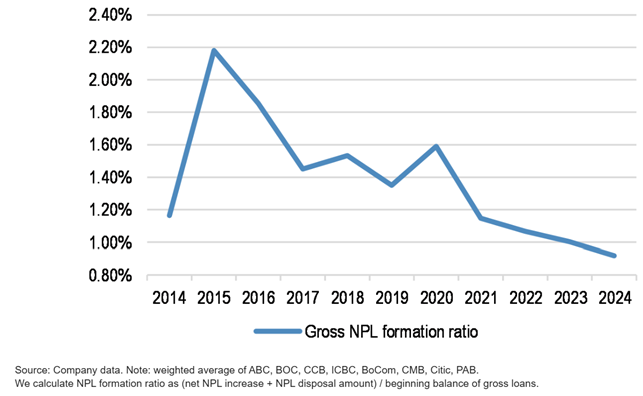
Source : Ox Capital research.In China, it has been four years since the property market peaked. Property prices have declined as much as 30 to 40% in most cities. Several large private property developers have defaulted and been liquidated. Notably, the banking system has negotiated its way through the property market downturn well, with bad debt formation for Chinese banks trending down since 2021. With the banking system intact, China is NOT Japan. The country is only working through a cyclical property market downturn, and it is at the later stage of this adjustment. We expect property prices to bottom in late 2026 / early 2027. Figure 7: NPL formation in China is showing a healthy decline and banks' balance sheets are resilient
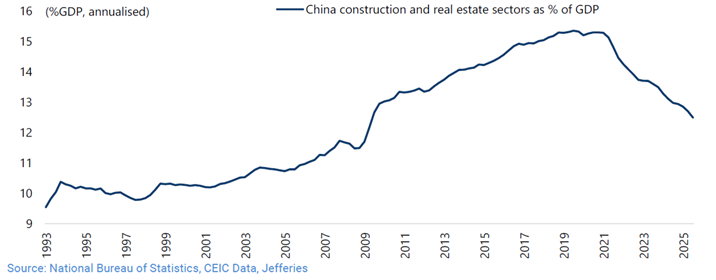
Source: JPMorgan.What is often less mentioned is the transformation of the Chinese economy. The construction and real estate sectors have shrunk as percentage of GDP. Figure 8: The construction and real estate sectors peaked at just over 15% of Chinese GDP in 2019, and are now around 12% of GDP
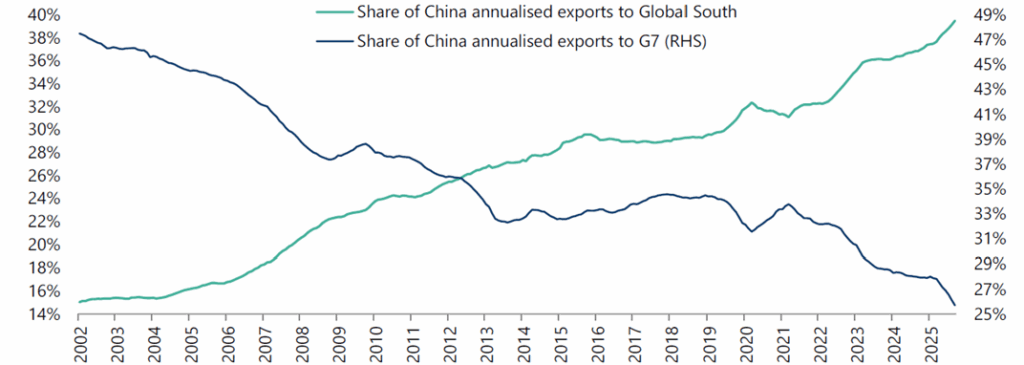
Source: Jefferies.Despite this, the Chinese economy still managed to grow ~5% p.a. between 2021 to 2025. The shortfall in growth coming from the slowing real estate and construction sectors was made up by the export and industrial sectors. Since the first Trump administration, China has been developing other export markets. Between 2021 to 2025, we can see the rise of Chinese exports to the Global South (ASEAN, Latin America, Africa, India, Pakistan, Saudi Arabia, UAE and Turkey), which have been able to offset falling exports to G7 nations. Figure 9: G7 nations are no longer the top end markets for Chinese exports
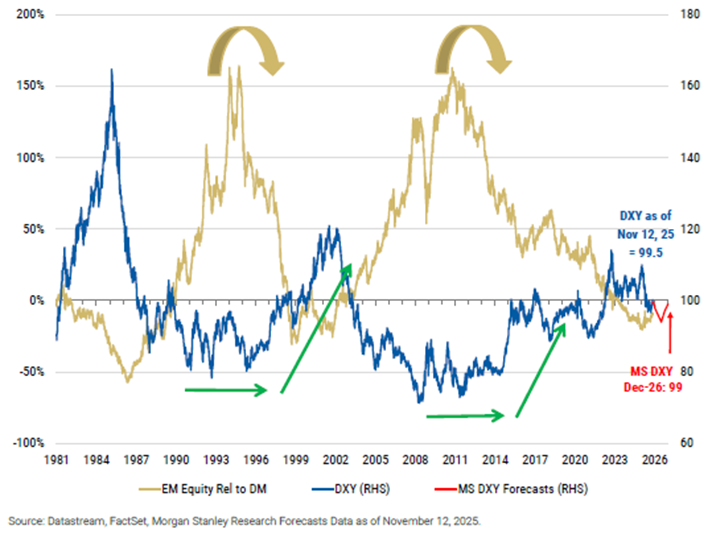
Source: Jefferies, CEIC Data, General Administration of Customs.Its growth potential is further bolstered by the rise of new and innovative industries. These days, China is the leading producer of solar and wind energy equipment. In 2023, it overtook Japan as the largest auto exporting country, and it is today leading the world in the transition to electric vehicles (EVs). While China is now having success in various industrial and manufacturing end markets, for a time there was a fear that US sanctions could hold back China in the technology race by restricting access to semiconductor technology. Instead of becoming stifled, China has made it a national priority to develop domestic semiconductor know-how. In some product segments, the domestic suppliers are finally good enough to be considered as replacements for foreign imports. After semiconductors, the next front was AI. Again, China has shown that it is firmly in the race after the unveiling of DeepSeek in January 2025. Chinese AI companies, along with the open source community, can innovate and are often much more cost effective than the well-known hyperscalers. In summary, EM economies are resilient and capable of withstanding external pressures. Emerging markets are "heating up" in 2026There are multiple catalysts on the horizon. We are optimistic on EM in 2026: The weak USD:As a rule of thumb, a weak USD is a tailwind for EM. Central banks in EM economies need to consider the impact on their currencies in their rate cut decisions. Hence, a weak USD affords EM economies greater flexibility, with inflation largely under control. A key event to watch next year is the appointment of the new US Federal Reserve Chairman, as Jerome Powell's term will expire in May 2026. If the new Federal Reserve looks to quickly cut rates to support the economy, there will be greater downwards pressure on the USD.
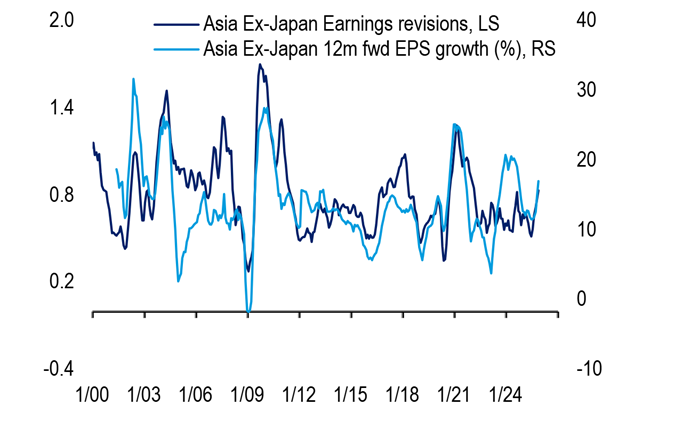
Source: Morgan Stanley.Anything-but-AI:AI has been the focus of investors for over two years now. Many traditional non-technology stocks have been left behind and de-rated. At some point in the future, momentum behind AI spending will inevitably slow. Hence, investors will need to look for the "anything-but-AI" investment. EM, in particular Asian equities, can be a fertile hunting ground for new ideas. Earnings are expected to grow strongly (17% YoY) in 2026 in Asia ex-Japan. Figure 11: Asia ex-Japan forward earnings growth forecasts are strong and expected to stay high in 2026
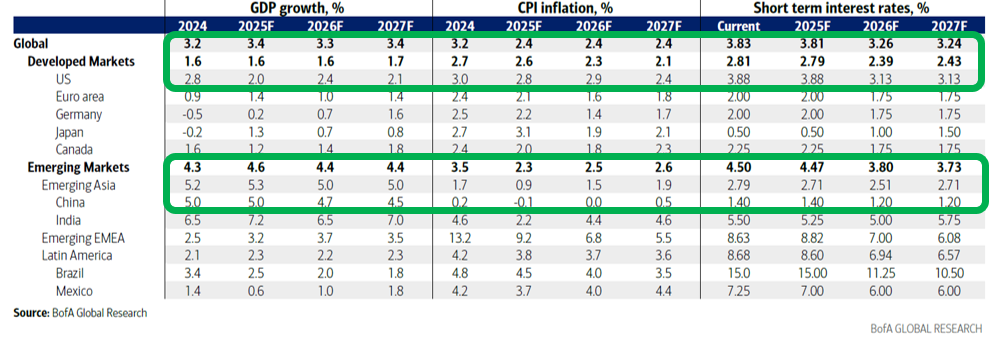
Source: BofA, MSCI, FactSet.EM macro is better:In 2026, EMs are expected to grow faster than DMs (4.4% vs. 1.6%, respectively). Low inflation and high real interest rates suggest further room for multiple rate cuts in many EM economies. An important catalyst to watch out for is new stimulus policies in China in 2026. Most investors are not expecting much on this front. There will be upside if and when the Chinese government delivers on these measures in 2026. Figure 12: GDP growth for EMs in Asia is higher than DMs in 2026
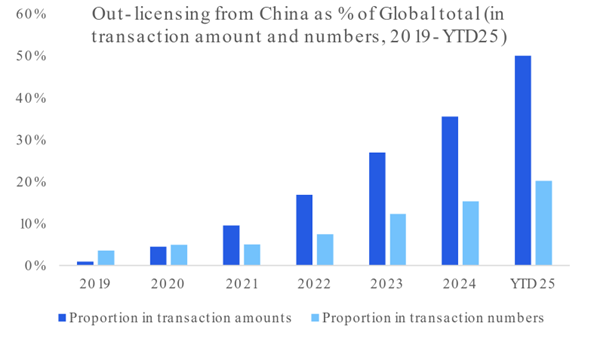
Source: BofA.Value-up/shareholder return:In 2025, we saw the rise of value-up programs emphasising minority rights in Asia. This is something we have not seen much of in our time investing in Asia. Korea, which drew attention from global investors with its value-up program, was one of the best performing markets in EM in 2025. Other countries are taking notice. Indonesia set up its sovereign wealth fund (Danantara) in February 2025. Danantara is pushing state-owned enterprises to improve return on equity, and provide better shareholder returns. Elsewhere, the Singaporean government is investing $5bn with fund managers under its market development program to improve the liquidity of small and mid-caps in Singapore. These initiatives can be rewarded more strongly as execution begins to come through. Sunrise industries:The US/China rivalry is leading to the rapid growth of many "sunrise" industries (and stocks) in China. China is looking to promote and create domestic champions to reduce its reliance on US suppliers. We are particularly encouraged by the strong returns seen in the Chinese biotech space in 2025 as investors have begun to wake up to their potential. Almost 50% of global drug licensing deals in 2025 were sourced from China. Outside of biotech companies, many of the emerging leaders in fields such as robotics, medical device, AI, SaaS, autonomous driving, LIDAR, semiconductor and fintech, for example, are listed and poised to deliver sharply accelerating growth in 2026 and beyond. Many of these companies are looking to expand globally. There are just as many exciting thematic ideas in EM as on the Nasdaq. Figure 13: China is beginning to dominate global drug licensing with its innovative companies
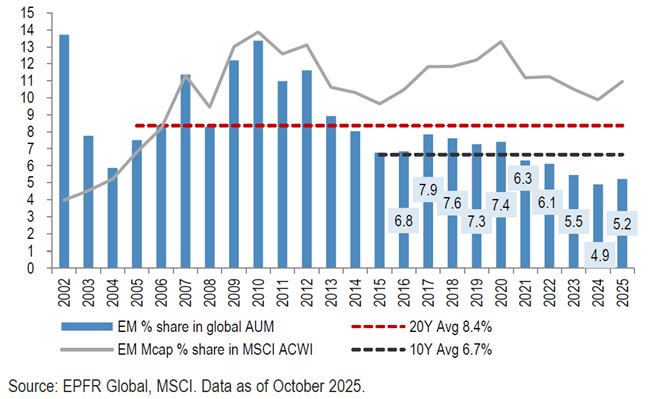
Source: Citi Research.Stronger shareholders in EM:EM equities are in stronger hands and better supported than in years past, making them less susceptible to global fund flows. While mainland capital used to only make up 10 to 15% of turnover in Hong Kong, Chinese investors have now displaced global funds as the key investor, regularly accounting for two to three times this volume today, at 25 to 30% of daily turnover. In addition, another nice surprise for us, compared to years past, is the fact that we are seeing Chinese companies buying back their stocks aggressively. Some companies have shareholder return targets of as much as 10 to 15% a year. Similarly, the Indian stock market is well supported by local investors (through their regular saving plans). The Indian market has been resilient despite foreigners reducing their positions throughout 2025. Time to sit back and enjoy the teaSince COVID and the Russian invasion of Ukraine, the world has been in a state of flux. The Trump administration has been working to re-cast the global order. Despite this, China has withstood and successfully countered challenges and a trade war with the US. Its local economy has proven sceptics wrong, and despite property prices being crunched in a bid by the Chinese government to reduce systematic risk, the banking system has hardly missed a beat. Outside of China, governments in EM are sticking to orthodox economics, by keeping budget deficits low, maintaining stable domestic currencies, with central banks fighting to keep inflation in check. Just like any good tea, it will take time to brew. Despite a favourable macroeconomic backdrop, global investors are only lightly positioned in EM, well below the historical average. Figure 14: EM positioning by global investors can pick up a long way from here |

4 Feb 2026 - Airlie Small Companies Fund Quarterly Update
|
Airlie Small Companies Fund Quarterly Update Airlie Funds Management January 2026 (Viewing time: 11 mins) |
|
The December quarter was an eventful period for Australian small caps, marked by shifting market conditions and evolving opportunities. In this quarterly update, Portfolio Manager Will Granger discusses how the small-cap landscape developed over the quarter and how the portfolio was actively positioned as conditions changed. He also outlines the investment thesis behind key holdings, including Joyce Corporation and PWR Holdings and explains what underpins conviction in these businesses as they have become more prominent positions within the Fund. Funds operated by this manager: Airlie Australian Share Fund , Airlie Small Companies Fund Important Information: This material has been delivered to you by Magellan Asset Management Limited ABN 31 120 593 946 AFS Licence No. 304 301 trading as Airlie Funds Management ('Airlie') and has been prepared for general information purposes only and must not be construed as investment advice or as an investment recommendation. This material does not take into account your investment objectives, financial situation or particular needs. This material does not constitute an offer or inducement to engage in an investment activity nor does it form part of any offer documentation, offer or invitation to purchase, sell or subscribe for interests in any type of investment product or service. You should obtain and consider the relevant Product Disclosure Statement ('PDS') and Target Market Determination ('TMD') and consider obtaining professional investment advice tailored to your specific circumstances before making a decision about whether to acquire, or continue to hold, the relevant financial product. A copy of the relevant PDS and TMD relating to an Airlie financial product or service may be obtained by calling +61 2 9235 4760 or by visiting www.airliefundsmanagement.com.au. Past performance is not necessarily indicative of future results and no person guarantees the future performance of any financial product or service, the amount or timing of any return from it, that asset allocations will be met, that it will be able to implement its investment strategy or that its investment objectives will be achieved. This material may contain 'forward-looking statements'. Actual events or results or the actual performance of an Airlie financial product or service may differ materially from those reflected or contemplated in such forward-looking statements. This material may include data, research and other information from third party sources. Airlie makes no guarantee that such information is accurate, complete or timely and does not provide any warranties regarding results obtained from its use. This information is subject to change at any time and no person has any responsibility to update any of the information provided in this material. Statements contained in this material that are not historical facts are based on current expectations, estimates, projections, opinions and beliefs of Airlie. Such statements involve known and unknown risks, uncertainties and other factors, and undue reliance should not be placed thereon. No representation or warranty is made with respect to the accuracy or completeness of any of the information contained in this material. Airlie will not be responsible or liable for any losses arising from your use or reliance upon any part of the information contained in this material. Any third party trademarks contained herein are the property of their respective owners and Airlie claims no ownership in, nor any affiliation with, such trademarks. Any third party trademarks that appear in this material are used for information purposes and only to identify the company names or brands of their respective owners. No affiliation, sponsorship or endorsement should be inferred from the use of these trademarks. This material and the information contained within it may not be reproduced, or disclosed, in whole or in part, without the prior written consent of Airlie. |

3 Feb 2026 - Global Matters: 2026 Outlook

2 Feb 2026 - Quarterly State of Trend report - Q4 2025
|
Quarterly State of Trend report - Q4 2025 East Coast Capital Management January 2026 3-minute read In this update, we present the quarterly State of Trend report for Q4, 2025. Our report covers the performance of trend following systems compared with traditional investments such as the S&P/ASX 200 Total Return index, and the Australia "60/40" portfolio. Trend following provides exposure to a diverse pool of underlying instruments, and implements trading strategies systematically and without emotional biases. Trend following outperforms Australian traditional assets In Q4 2025, Australian traditional risk assets faced headwinds as policy uncertainty, global growth concerns and persistent inflation volatility weighed on investor sentiment. Trend following systems delivered strong positive returns, benefitting from sustained momentum in metals, international equities and selective currencies. Key market movements in Q4 2025
Featured chart - Silver
See the full report at our website. Funds operated by this manager: |