
News

4 Mar 2026 - Volatility Is Information: Reading the Signals Beneath the Surface
|
Volatility Is Information: Reading the Signals Beneath the Surface JCB Jamieson Coote Bonds February 2026 (3-minute read) The investment outlook this year remains shrouded by uncertainty, accompanied by elevated volatility in expected returns. Markets are searching for direction, and investors are navigating an environment where conviction feels harder earned. Volatility, of course, wears many faces. We can observe it in the lived experience of asset price return variability across securities, sectors and markets. Or we may deduce the anticipated range of returns over the next week, month or quarter from options prices. Either way, the direction, size and interdependencies (correlations) of movements in market pricing at all frequencies can provide important signals for astute investors. Volatility is not simply noise, it is information. Right now, equity prices, cryptocurrencies, and precious metals are relatively more volatile. Yet in contrast, most bond markets remain curiously subdued. Yields remain broadly rangebound, only tentatively challenging the edges of recent ranges, reticent to enter an elusive new regime or steady state. That restraint in bond markets is notable, and perhaps more revealing than the visible turbulence elsewhere. After hiking rates earlier this month, RBA Governor Michelle Bullock stopped short of offering explicit forward guidance, indicating that the Monetary Policy Board is heavily data dependent. This suggests further policy restriction may have limited efficacy in controlling persistently above-band inflation back to the target range. Australian government bond yields decreased markedly in response, and the market is paring back pricing for hikes and beginning to tentatively pre-empt future rate cuts next year. The tone has shifted, from further restriction to a growing debate about how long policy will need to remain restrictive at all. More broadly, attention is turning to the Government for direction ahead of the upcoming Federal Budget. There is growing recognition that boosting labour productivity through innovation, enhanced competition and meaningful structural and tax reform remains the only sustainable path to higher national income and improved living standards for all Australians. Meanwhile, across the Pacific in the U.S., economic activity continues to show surprising resilience. January brought unexpectedly strong employment growth, thanks in part to seasonal factors (despite large historical downward revisions). Price pressures, meanwhile appear to be cooling, although the data remains messy and influenced by lingering U.S. federal government shutdown-related disruptions. The result? Short-dated Treasury yields have drifted to multi-year lows, reflecting cautious optimism among investors. The market has almost priced for three U.S. Federal Reserve rate cuts this year under U.S. Federal Reserve Chair nominee Kevin Warsh, although the upcoming midterm elections loom large over the U.S. macro outlook and the Trump administration's near-term policy priorities. In Europe, inflation appears to be well controlled and the European Central Bank comfortably on hold, but recent geopolitical events have raised existential questions around the protection and advancement of national and regional interests, and defence and security strategy. While this may be the quintessential European moment to rebalance the world order away from U.S. dominance if traditional allegiances like NATO are set to be dissolved, there have been fundamental disagreements between Germany and France around policy priorities to restore competitiveness and how to fund quickly growing defence expenditures. Yields on German government bonds have also dropped materially in recent weeks. In Japan, the Liberal Democratic Party lead by Sanae Takaichi has emerged victorious from lower house elections. Takaichi's expanded mandate and firm command over political and economic power (for instance, Japan's central bank is not independent of government) after her historic win, combined with a sense of renewed optimism across global markets that the realisation of her vision for Japan will not unduly impact interest rates and exchange rates beyond what is already envisaged, has led to a relief rally in Japanese Government Bonds after a tumultuous January. What signal can we draw from the subdued historical measures of volatility across bond yields, especially when viewed against the domestic and global macro backdrop? There are three key takeaways. First, periods of volatility and uncertainty (whether obvious or hidden) can bring significant opportunity to generate attractive returns for those who act thoughtfully. Second, fortune rewards the diligent and there are only downside risks to complacency. And third, and most importantly, diversification, both within and across asset classes and sectors is the primary means with which to dampen the effects of volatility and protect long-term investment outcomes. Volatility may rattle markets, but it also sharpens our focus, driving better portfolio construction and smarter asset allocation decisions. Funds operated by this manager: CC Jamieson Coote Bonds Active Bond Fund (Class A) , CC Jamieson Coote Bonds Dynamic Alpha Fund This information is for professional and wholesale investors only and has been prepared by JamiesonCooteBonds Pty Ltd ACN 165 890 282 AFSL 459018 ('JCB'). Channel Investment Management Limited ACN 163 234 240 AFSL 439007 ('CIML') is the Responsible Entity and issuer of units for the CC JCB Active Bond Fund ARSN 610 435 302, CC JCB Global Bond Fund ARSN 631 235 553 and the CC JCB Dynamic Alpha Fund ARSN 637 628 918 (collectively 'the Funds'). Channel Capital Pty Ltd ACN 162 591 568 AR No. 001274413 ('Channel') provides investment infrastructure and distribution services for JCB and is the holding company of CIML. |

3 Mar 2026 - Phil Strano: Levered credit back from the dead
|
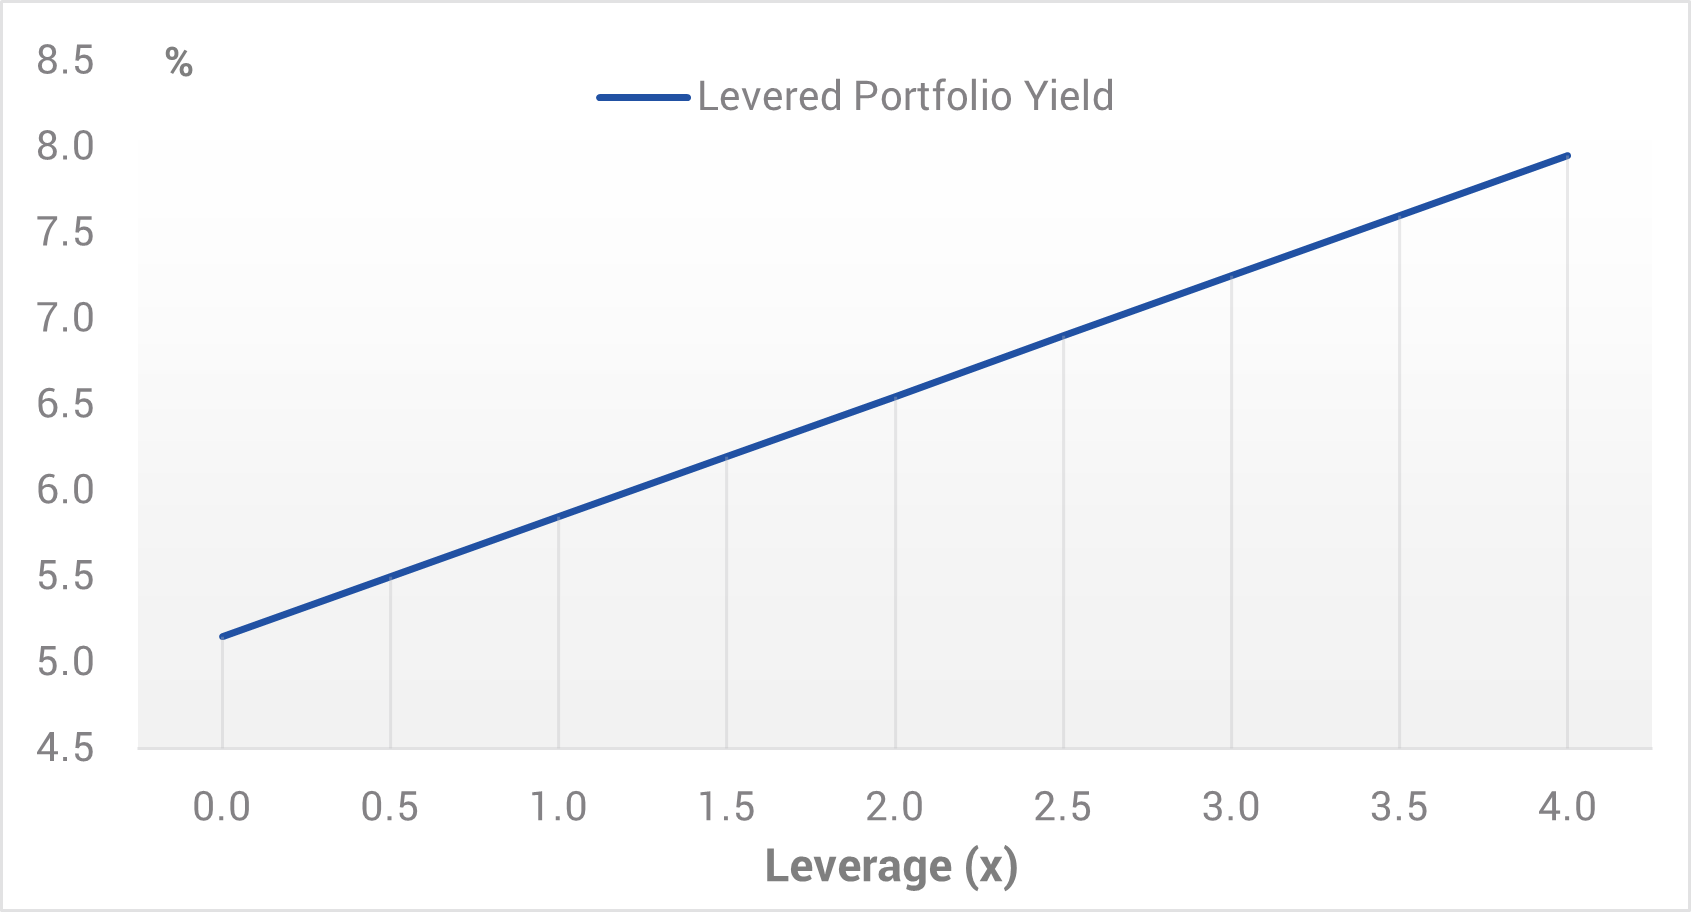
Phil Strano: Levered credit back from the dead Yarra Capital Management February 2026 (8-minute read) In 2025, with credit spreads normalising, and in some segments moving below long-term averages, a number of yield hungry credit investors responded by adding risk to meet investment objectives. These additional risks to sustain portfolio yields of 6%+ varied from increasing credit risk, interest/spread duration and/or leverage. While mostly still at manageable levels, increased debt funding of credit securities is nonetheless a throwback to the heady pre-GFC era where synthetic and physical leverage was more commonplace. Indeed, we are now also hearing of less sustainable practices once again creeping into the credit investment lexicon. From our discussions in the marketplace towards the tail-end of 2025, the use of leverage is principally occurring through the use of repurchase agreements (repo) of eligible collateral up to an eye watering 15-times for AAA rated securities, as well as via placement of senior secured leverage to enhance portfolio yields in both private and public credit portfolios. New levered investment products that have recently entered the market offer a floating rate running yield from a portfolio likely comprised of major bank T2 hybrids (T2s) and investment grade (IG) corporate bonds. Products such as these typically seek to enhance yield by deploying 3-3.5-times leverage. Leverage enhances yields and amplifies performance (both positively and negatively) from changes in spreads and any impairments/defaults. Working off current pricing, an IG portfolio yielding ~5.0-5.5% p.a. with ~3-times leverage moves what is an already enhanced yield into a yield in the 7%+ range (refer Chart 1). Chart 1: YCM estimate: Levered IG portfolio yields
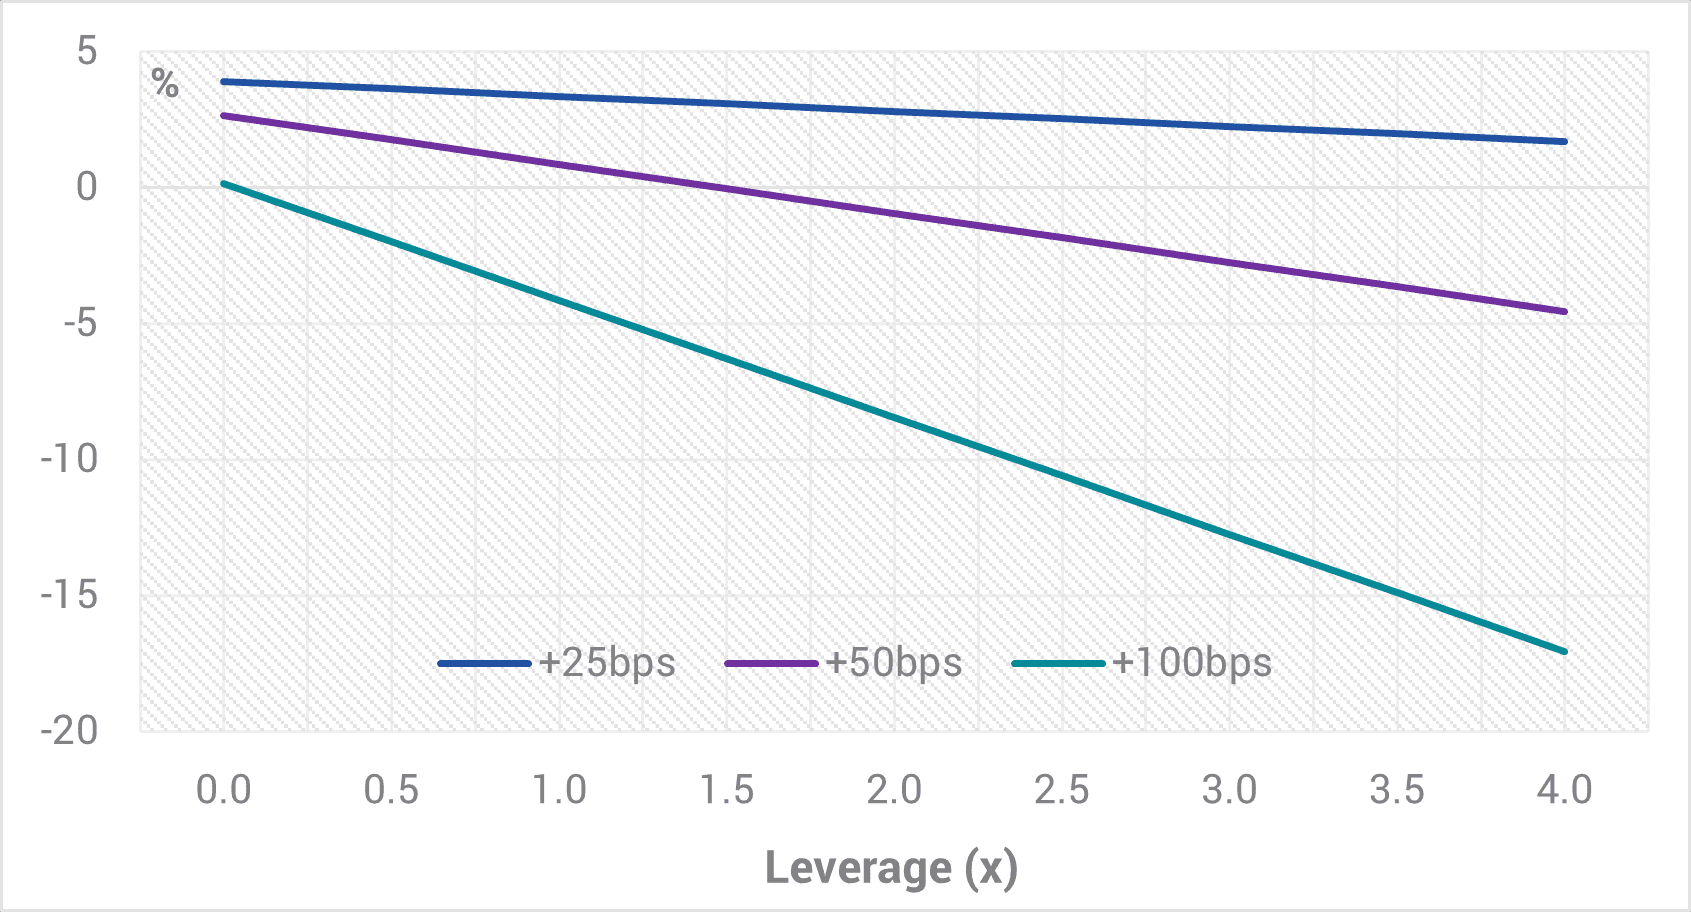
Source: Yarra Capital Management Feb 2026.The use of leverage to enhance returns can work very effectively in environments of stable or contracting credit spreads. It is a double-edged sword, however, with the combination of widening credit spreads and leverage usually resulting in significant drawdowns. For instance, working off an estimated credit spread duration of ~5 years, a widening spread environment would quickly overwhelm underlying yields, with a ~100bp spread expansion on 3-times leverage generating a negative total return in the range of 10-15% from what is an underlying low risk IG credit portfolio (refer Chart 2). Chart 2: YCM estimate: Levered total returns and widening credit spreads
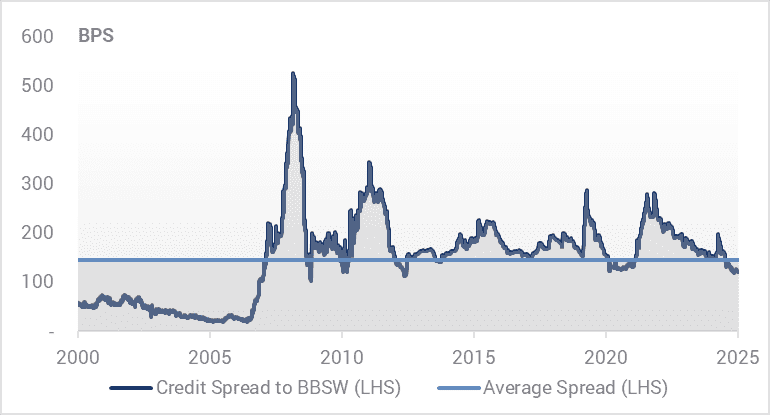
Source: Yarra Capital Management Feb 2026.Given fixed income investors generally have a low tolerance for negative returns over a 12-month period, the use of significant leverage to enhance returns could be somewhat of a dubious exercise, especially when you consider today's starting point. As evidenced by major bank T2s, credit spreads have performed over the last 2-3 years and now sit around their long term averages across most segments of Australian credit and significantly below the previous peak in 2022 (refer Chart 3). Chart 3: Major Bank Tier 2 5-year FRNs (credit spreads and yields)
Source: Yarra Capital Management Feb 2026.At current spread levels, the probability of a +/-100bp move is weighted to the positive and in the current macroeconomic environment is entirely possible over the near to medium term. In such an event, which can occur two to three times each decade, the prospect of equity like drawdowns from levered credit funds should give credit investors pause for thought. Put more simply, credit investors in these levered structures should be thinking hard about whether they are comfortable taking what is effectively equity drawdown risk for a miserly 1-2% in additional yield. We would suggest that this represents incredibly poor compensation for the risk assumed at this point in the cycle. In contrast to levered credit funds, both the Yarra Enhanced and Higher Income Funds are still providing attractive 6-7% yields with precisely zero leverage. Moreover, while it is true that a 100bps widening in credit spreads would lead to value diminution for both these funds, high unlevered yields combined with active management should protect against negative returns over any 12-month period. We do not believe the same can be said of levered credit funds running a similar mix of underlying credit assets. |
|
Funds operated by this manager: Yarra Australian Bond Fund , Yarra Australian Equities Fund , Yarra Emerging Leaders Fund , Yarra Income Plus Fund , Yarra Enhanced Income Fund , Yarra Australian Smaller Companies Fund , Yarra Ex-20 Australian Equities Fund , Yarra Global Small Companies Fund , Yarra Higher Income Fund |

2 Mar 2026 - Data demand heats up

26 Feb 2026 - How investors can still ride the gold surge
How investors can still ride the gold surgePendal February 2026 (5 minutes read time) |
|
GOLD and silver prices have been riding a rollercoaster since the start of the year, but Pendal portfolio manager Brenton Saunders -- who has worked as a geologist -- argues there are still plenty of opportunities in midcap equities exposed to these metals. Total gold demand in 2025, including over-the-counter sales, exceeded 5,000 tonnes for the first time, according to the World Gold Council (WGC). Last year, the safe-haven metal set 53 new all-time price highs which yielded an "unprecedented value" of US$555 billion - a 45 per cent year over year increase, WGC data shows. The reason: heightened investment activity driven by safe-haven and diversification moves that culminated in the second strongest year on record for exchange traded fund-inflows and elevated central bank buying. Although central bank purchases slowed from their recent pace, they hit the upper end of the WGC's forecast, totalling 863 tonnes for the year. Bar and coin buying also reached a 12-year high. This led to the gold price marking its highest annual average at US$3,431 an ounce - a 44% spike year over year. "Central banks have been buying it hand over fist; retail investors have been buying it hand over fist, the dollar has been weakening, and geopolitics have been pretty elevated," explains Saunders, who manages Pendal's MidCap Fund. "If you go back to the late 90s/early 2000s central banks were all selling gold. It was an old asset. Nobody needed it anymore. It was defunct," explains Saunders. "Most of the OECD countries sold most of their gold reserves. The US was probably the only one that didn't. "But now you've seen a very broad-based and especially emerging market purchase of gold. So it's re-legitimised gold in a major way in terms of its role as a reserve asset the world over." Silver, meanwhile, is also a beneficiary of the market ructions, hitting its highest point on record in late January when it rose above US$120 an ounce. An additional key driver of the recent price surge in gold's poorer cousin is the high demand for silver as an industrial metal input for solar panels. "We now use a lot of it, especially in solar panels," says Saunders. "That's probably the biggest industrial use for silver now, but it's always been a second-tier reserve currency investment product that has done the rounds. "So it's move more recently is obviously being helped by the fact that solar manufacturing is still elevated and now we've seen some investment demand come to the fore." But while gold and silver prices have run hard, this hasn't necessarily been reflected in the share prices of gold and silver stocks. 'Scepticism gap'Saunders points to the 'scepticism gap' between the price of the physical metals versus the equities exposed to them. "Because the move in the gold price has been so rapid the market has been highly sceptical of pricing in that scenario because they're constantly questioning what will happen if the gold price comes back. "So the equities, not just gold equities but especially in gold, have been quite reticent to reflect in their share prices the full move in the gold price." However, Saunders argues that the price could drop by US$1,000 and still be at a "bonanza level", meaning gold-exposed companies "could weather quite a big correction in the gold price without much impact to the value of the company's operational considerations". A "bonanza-level" gold price affords operations more flexibility, allowing them to mine areas that historically were not economic to consider. This increases reserves and profitability. "That is the one thing that gives me a bit of comfort, and I think investors ultimately a bit of comfort," says Saunders. "If I look at consensus earnings for gold companies, they're still reflecting a significantly lower gold price than prevails today. "So that should mean if the gold price stays at the current level, we'll continue to see earnings upgrades and that normally underpins share prices. "Those are the things that make me hopeful that it should still be a fairly constructive sector from an investment perspective." |
|
Funds operated by this manager: Pendal MicroCap Opportunities Fund , Pendal Global Select Fund - Class R , Pendal Sustainable Australian Fixed Interest Fund - Class R , Pendal Focus Australian Share Fund , Pendal Horizon Sustainable Australian Share Fund , Regnan Credit Impact Trust Fund , Pendal Sustainable Australian Share Fund , Pendal Sustainable Balanced Fund - Class R , Pendal Multi-Asset Target Return Fund |
|
This information has been prepared by Pendal Fund Services Limited (PFSL) ABN 13 161 249 332, AFSL No 431426 and is current as at December 8, 2021. PFSL is the responsible entity and issuer of units in the Pendal Multi-Asset Target Return Fund (Fund) ARSN: 623 987 968. A product disclosure statement (PDS) is available for the Fund and can be obtained by calling 1300 346 821 or visiting www.pendalgroup.com. The Target Market Determination (TMD) for the Fund is available at www.pendalgroup.com/ddo. You should obtain and consider the PDS and the TMD before deciding whether to acquire, continue to hold or dispose of units in the Fund. An investment in the Fund or any of the funds referred to in this web page is subject to investment risk, including possible delays in repayment of withdrawal proceeds and loss of income and principal invested. This information is for general purposes only, should not be considered as a comprehensive statement on any matter and should not be relied upon as such. It has been prepared without taking into account any recipient's personal objectives, financial situation or needs. Because of this, recipients should, before acting on this information, consider its appropriateness having regard to their individual objectives, financial situation and needs. This information is not to be regarded as a securities recommendation. The information may contain material provided by third parties, is given in good faith and has been derived from sources believed to be accurate as at its issue date. While such material is published with necessary permission, and while all reasonable care has been taken to ensure that the information is complete and correct, to the maximum extent permitted by law neither PFSL nor any company in the Pendal group accepts any responsibility or liability for the accuracy or completeness of this information. Performance figures are calculated in accordance with the Financial Services Council (FSC) standards. Performance data (post-fee) assumes reinvestment of distributions and is calculated using exit prices, net of management costs. Performance data (pre-fee) is calculated by adding back management costs to the post-fee performance. Past performance is not a reliable indicator of future performance. Any projections are predictive only and should not be relied upon when making an investment decision or recommendation. Whilst we have used every effort to ensure that the assumptions on which the projections are based are reasonable, the projections may be based on incorrect assumptions or may not take into account known or unknown risks and uncertainties. The actual results may differ materially from these projections. For more information, please call Customer Relations on 1300 346 821 8am to 6pm (Sydney time) or visit our website www.pendalgroup.com |

25 Feb 2026 - The rise of grounded sustainability and why it's here to stay
|
The rise of grounded sustainability and why it's here to stay abrdn February 2026 (4-minute read) In the five years since the Glasgow-based COP26, sustainable investment initially surged. Expectations were high, pledges were ambitious, and many believed capital markets could play a decisive role in addressing climate change and broader environmental and social challenges. But more recently, geopolitical shocks, legal scrutiny and market realities have tempered that optimism. In its place, a more durable approach is emerging, which we describe as grounded sustainability. It's a framework for incorporating sustainability factors into investment decisions, where those factors are financially material and aligned with client mandates. It's evidence-led and recognises inherent trade-offs. Importantly, it's clear about the limits of what investors and companies can achieve within the constraints of public policy. Mandates and market realitiesOver the past five years, conflicts, the global energy crisis, and the resurgence of populist politics have created a more fragmented, unpredictable and idiosyncratic environment. For example, coal use rose during the energy crisis, even as renewable deployment consistently exceeded expectations. This highlights the growing regional and thematic divergence. With this complex backdrop, sustainable investment must balance long-term systemic goals with the constraints imposed by mandates, markets and regulation. Ambition alone isn't enough. It must be combined with pragmatism. Importantly, it must also align with clients' financial objectives and constraints, otherwise commitments risk becoming empty promises - or worse, reputational liabilities. Climate law gets real: from global duties to corporate liabilityLegal frameworks are catching up with climate ambition. The International Court of Justice's (ICJ) recent advisory opinion [1] clarifies that states have a legal duty to prevent environmental harm, including to the climate system. It also clarifies that a lack of regulation doesn't absolve other actors - whether companies, asset managers or investors - from managing foreseeable risks. This shifts climate accountability from voluntary action to legal risk. Policy as a catalystThis is where effective policy matters. Recent European initiatives to align climate objectives with industrial competitiveness and energy security reflect growing recognition that markets alone cannot deliver the transition at scale. Together, they signal a shift from fragmented initiatives to coordinated, state-backed action, while offering companies and investors the long-term policy clarity that has been missing. This is why we are calling for greater long-term policy certainty, which retains strategic intent while limiting unnecessary complexity. This is the essence of grounded sustainability: integrating environmental and social factors when they are material to value, and doing so with clarity, discipline, and alignment to mandates. What does this mean for investors?Sustainability concerns need not be sidelined in financially focused mandates. Forward-looking considerations of material environmental and social risks are fully consistent with long-term value creation. What cannot be justified is pursuing sustainability outcomes that are disconnected from financial objectives, unless explicitly agreed with clients. This is the essence of grounded sustainability: integrating environmental and social factors when they are material to value, and doing so with clarity, discipline, and alignment to mandates. Policy is the missing link. Without it, companies struggle to act without breaching fiduciary duties or losing market share. With it, sustainability themes become investable, scalable, and defensible. Looking forwardWe expect that the rise of climate risks - coupled with increasing energy and mineral demands to facilitate technology advances and the energy transition - will mean that sustainability themes will remain at the heart of many geopolitical tensions. This will apply whether they are presented as energy transition, resilience or strategic government objectives (such as economic competitiveness or national security). Overall, we expect the policy landscape to remain uneven, with less support than previously. But where outcomes align with strategic government objectives, policy support will surely follow. Final thoughts...A recalibration is needed to find an equilibrium, where sustainability is seen as a fundamental tool for making better investment decisions, rather than being wrapped up in unrealistic expectations. The sector needs to evolve from idealism to pragmatism, grounded in legal clarity, mandate alignment and financial materiality. Despite the potentially gloomy outlook, we've seen record investment in the energy transition - twice as much as in fossil fuels. So it's not about abandoning sustainability themes. Rather, it's about doing it deliberately and within real-world constraints. |
|
Funds operated by this manager: abrdn Sustainable Asian Opportunities Fund , abrdn Emerging Markets Equity Fund , abrdn Sustainable International Equities Fund , abrdn Global Corporate Bond Fund (Class A) |

24 Feb 2026 - 2025 Responsible Investment and Stewardship Report

23 Feb 2026 - Australian Secure Capital Fund - Property Update
|
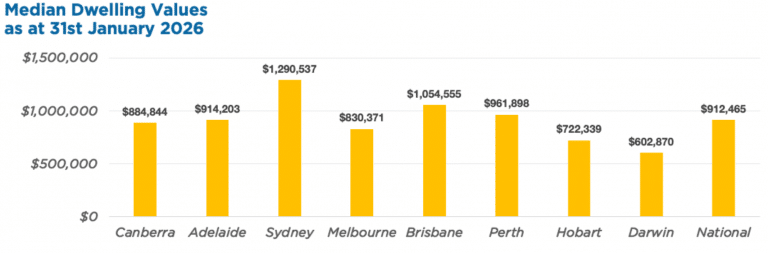
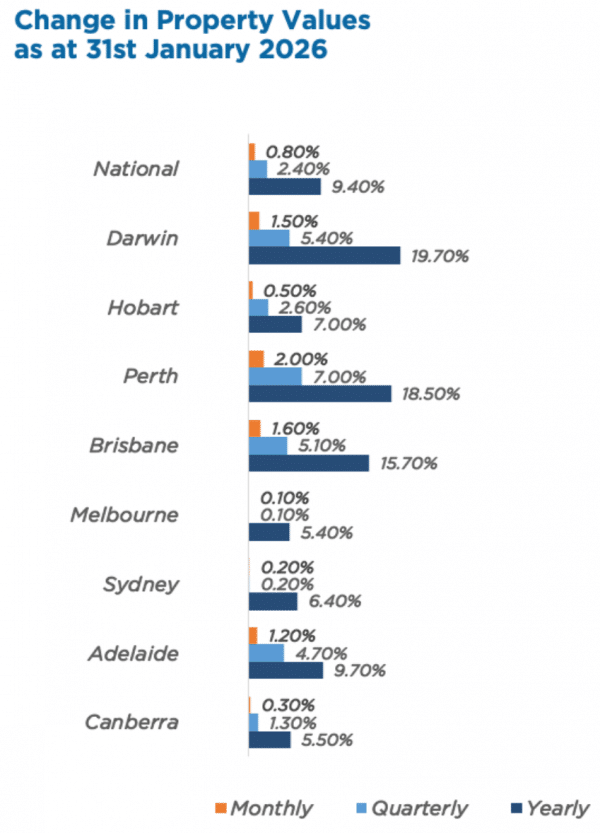
Australian Secure Capital Fund - Property Update Australian Secure Capital Fund February 2026 (1-minute read) House prices bounced back in January after a slower December, rising by 0.8% nationally. After slight falls last month, values in Melbourne and Sydney rebounded, while Brisbane, Adelaide, Perth, and Darwin all saw increases of 1.2% or greater. More broadly, the national median dwelling value surged by 9.4% over 2025--almost double the 4.9% national rise seen in 2024. Regional markets outperformed capital cities with a 10.3% annual rise and 1% monthly rise, compared to 9.2% and 0.7% rises, respectively, for the capitals. Across the capital cities, house values in the lower quartile increased by 1.3% in January, compared to a 0.3% rise in the upper quartile.
Source: Cotality HVI, 02 Feb 2026 February Edition Funds operated by this manager: ASCF Select Income Fund , ASCF High Yield Fund , ASCF Premium Capital Fund , ASCF Private Fund
|
19 Feb 2026 - Volatility providing fertile ground in active credit
|
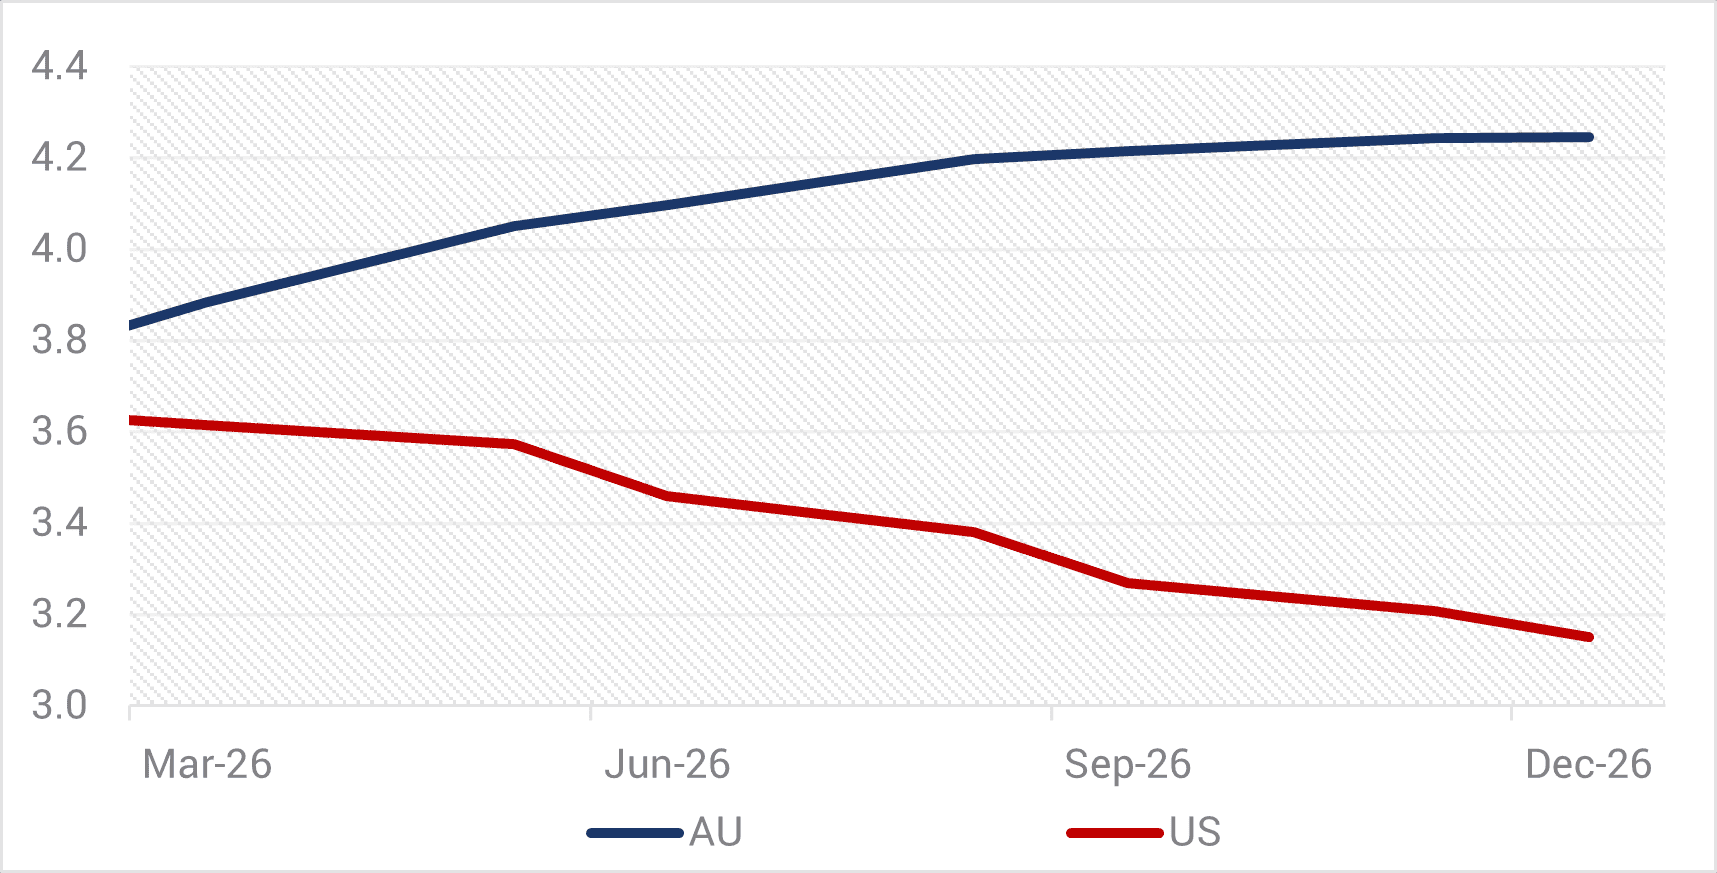
Phil Strano: Volatility providing fertile ground in active credit Yarra Capital Management February 2026 In this instance, the direction change is Australia's late 2025 bond selloff, culminating in a 25bp hike from the RBA this week and with the prospect of more hikes through 2026. Looking forward, current market pricing for 2026 shows a widening gap between the RBA cash rate and the FED funds rate, with the pricing of rate hikes in Australia in stark contrast to the US where easing appears virtually certain (refer Chart 1). Chart 1: Cash Rate Futures - US and Australia (%)
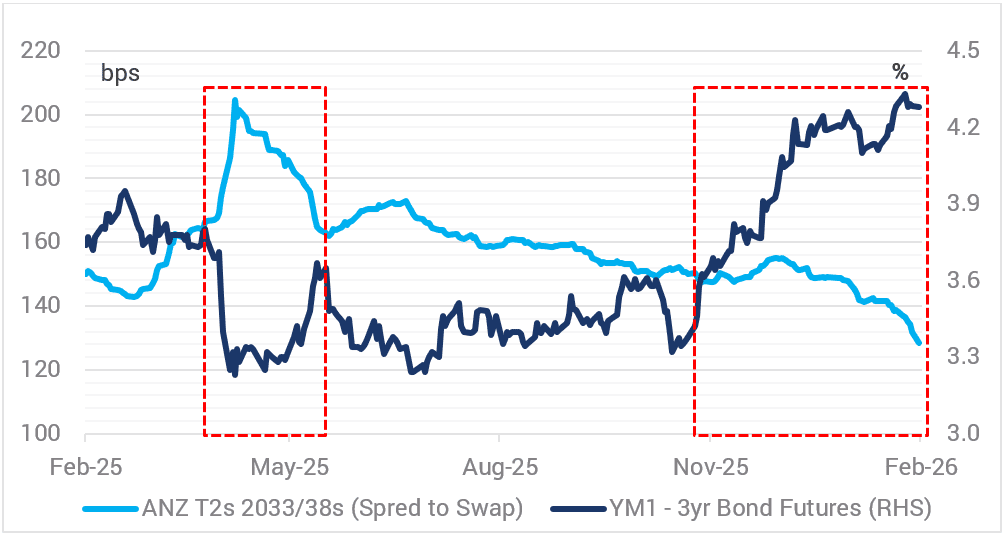
Source: Bloomberg, Yarra Capital Management Feb 2026.While the year ahead can pan out differently since actual movements in interest rates in some instances can bear little resemblance to the futures market at any point in time, pricing is always eventually reflected in security valuations across Australian credit and thus impacts investment decisions. For us, higher bond yields in the closing months of 2025 enabled a rebuild of strategic duration at ~1.7 years across both our Enhanced Income and Higher Income strategies. While market timing is never perfect, this duration positioning - where we have a skew to the front end - should help limit any drawdowns from risk offs in 2026. This period reminds us of April 2025, where both strategies generated positive performance despite credit spreads moving materially wider. We believe a similar scenario can play out in 2026 (refer Chart 2). Chart 2: Australian 3-year Interest Rates and ANZ 2033/38 T2 Credit Spreads
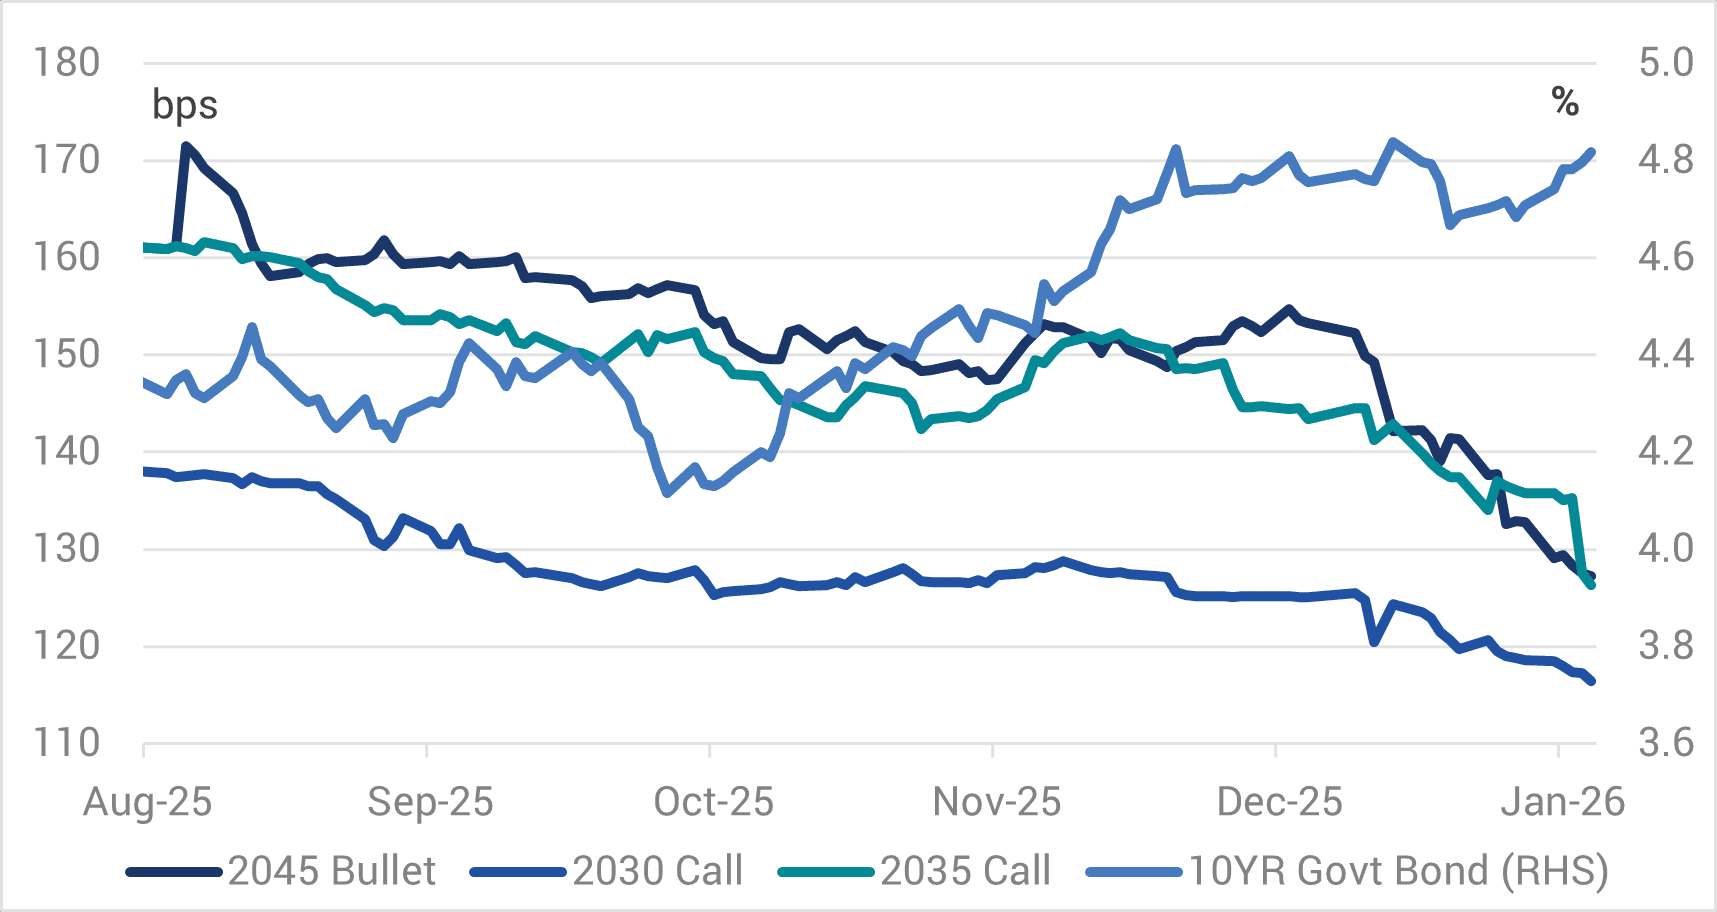
Source: Bloomberg, Yarra Capital Management Feb 2026.Another key theme through 2025 was the 6%+ "mania" which appears to be back with gusto. A pool of investors attracted to higher outright yields, especially longer dated major bank T2s, appear to be forgoing adequate credit spread compensation and happily accepting higher spread and interest rate duration risk to achieve their 6%+ yield objectives. Our analysis of the ANZ T2 credit curve illustrates the poor credit spread compensation that is currently on offer for the longer dated 2035 (call) and 2045 (bullet) maturities (refer Chart 3). Chart 3: ANZ T2 $A Securities Credit Spreads and Government Bond 10-year Yields
Source: Yarra Capital Management Feb 2026.Unsurprisingly, the significant contraction in the credit spreads on longer dated T2s is closely correlated with the rise in government bond yields and ANZ's T2 credit curve, as with the other major banks, is unattractively flat. We have taken this opportunity to rotate out of these longer-dated T2s given the inadequate spread compensation, preferring instead to be invested in shorter dated T2s such as the 2030s which are paying comparable credit spreads but with much less risk. While we are rotating out of longer-dated T2s, we remain comfortable investing in longer dated securities provided the credit spread compensation is commensurate to the risk assumed. In early February, we invested in the 5 and 10-year BBB rated Aroundtown bonds. While these securities are more off Broadway than the major bank T2s, the 10-year securities priced at an attractive 200bps credit spread and a yield of 6.72%. This deal provided ~70bps additional compensation for two notches lower credit quality (i.e. approximately double the normal compensation over A- rated major bank T2s). |
|
Funds operated by this manager: Yarra Australian Bond Fund , Yarra Australian Equities Fund , Yarra Emerging Leaders Fund , Yarra Income Plus Fund , Yarra Enhanced Income Fund , Yarra Australian Smaller Companies Fund , Yarra Ex-20 Australian Equities Fund , Yarra Global Small Companies Fund , Yarra Higher Income Fund |

18 Feb 2026 - Australian economic view - February 2026
|
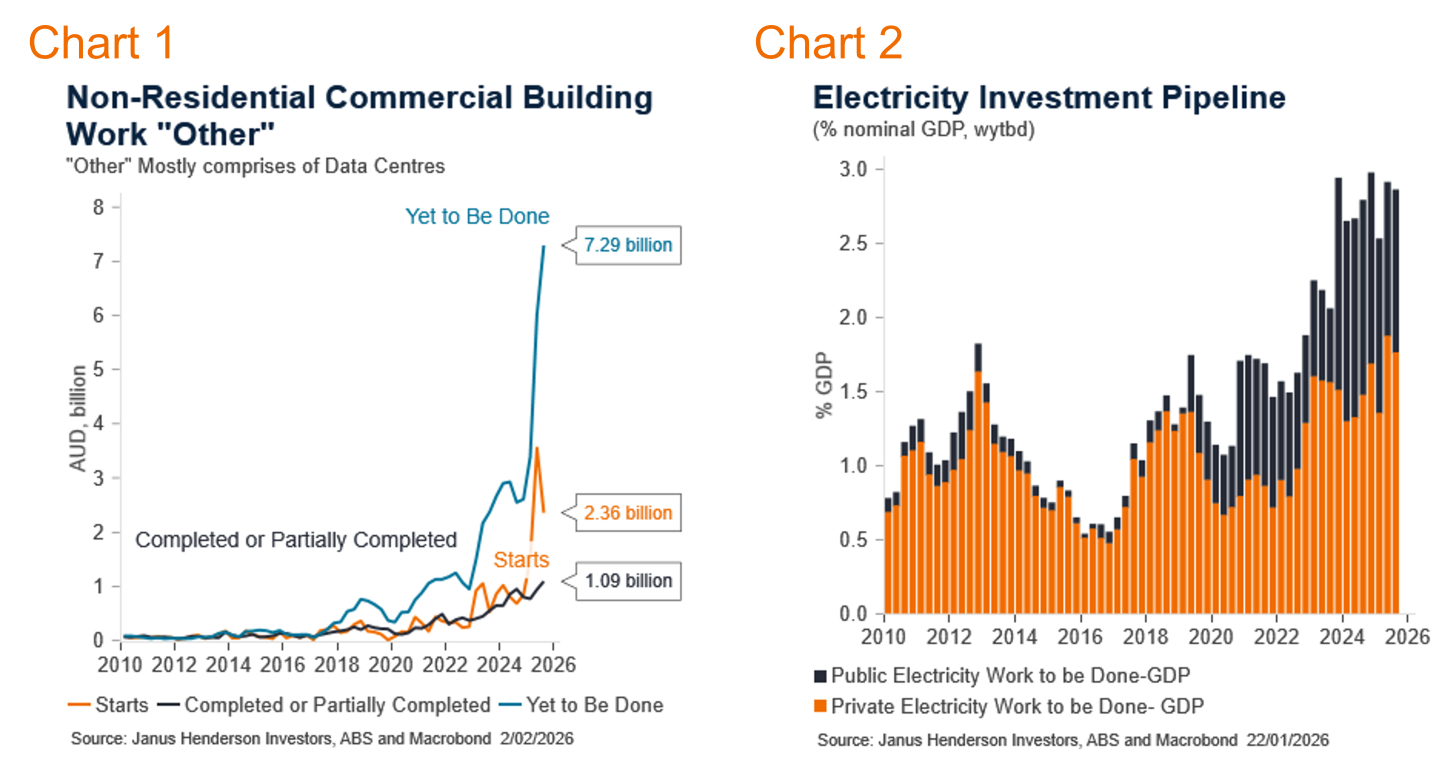
Australian economic view - February 2026 Janus Henderson Investors February 2026 (7-minute read) Market reviewSolid domestic data contributed to reinforcing near term lift in yields. The Australian bond market, as measured by the Bloomberg AusBond Composite 0+ Yr Index, rose 0.21%. The Reserve Bank of Australia (RBA) did not meet in January, therefore the cash rate remained at 3.60%. Three-month bank bills rose 10 basis points (bps) to 3.84% by month end. Six-month bank bill yields fell 3bps to 4.09%. Australia's three-year government bond yields ended the month 13bps higher, at 4.27%, 10-year government bond yields were 7bps higher at 4.81%. January was an extraordinary month in terms of global, geopolitical events and central bank uncertainty. From the US demanding Greenland, to ousting the Venezuelan leader, and instigating a criminal probe into Federal Reserve Chair Powell. What is more remarkable is the market's mostly benign response to the newsflow. Amid a general level of uncertainty, demand for assets continues to outweigh any potential global blowback. Peripheral markets are showing the impacts, volatility in gold and silver prices and a weakening US dollar are key indicators of that unease. While these broad events are ongoing, providing a backdrop to the domestic market, at this point, they are not driving them. The local economy shows elevated inflation, with the RBA's main measure, the trimmed mean quarterly series, at 3.4%yoy. The new monthly headline series remains at 3.8%. A series of administrative prices and one-offs have driven the headlines. Underlying this is steadying energy and rent prices, proving some degree of comfort ahead. The labour market remains highly volatile, with large changes month-to-month. The unemployment rate has dropped to 4.1%, but employment growth is low. Consumer confidence has dropped on the prospect of higher interest rate increases, while major city house prices are similarly subdued. A case for RBA hikes can be made this year. The upcoming artificial intelligence (AI) related capital expenditure cycle is expected to contribute significantly to demand and come up against supply constraints. Much of this comes in H2 and beyond. Initially, the household sector remains sensitive but should stabilise. Risk markets continued their solid momentum into 2026. Domestically, corporate and structured credit primary markets opened strongly with a range of issuers issuing bonds. Against a broadly constructive background for credit, the Australian iTraxx Index closed 2bps wider at 66bps, while the Australian fixed and floating rate credit indices returned +0.32% and +0.46% respectively. Market outlookWe have updated our RBA base case, looking for a series of hikes through 2026, into 2027. While our hikes are later than current market pricing, they move higher than that priced into 2027. Our high case is one where inflation remains elevated and the RBA are forced to raise interest rates more than expected in H1 2026, continuing higher through the year and into 2027. This has a 10% weight. Our low case reflects a weaker economic outcome, if global uncertainties are renewed and the labour market deteriorates. We hold a modest long duration position, targeted on the curve, and remain vigilant to take advantage of market mispricing. Monthly focus - Make way for AI InvestmentThe AI investment boom is upon us, we knew it was coming but the third quarter of 2025 showed that its appearance was perhaps sooner than expected. The trajectory is by no means guaranteed. There is a desire by policy makers, and players alike, to facilitate progress but some perspective on quantum, and constraints, provide a useful guideline to the path ahead. The AI sector influence on the economy initially shows up in investment. The productivity enhancements come later. Australia is seen as having a comparative advantage in terms of global geopolitics, economic conditions and availability of renewable energy sources. Given this, it is reported that the build and placement of data centres (DC) in Australia is higher than in comparative countries. Australia will benefit from setting up DC in Australia that service both local and non-Australian clients. The rise in DC building has been dramatic. This captured economist's attention in the third quarter data set, surging ahead. To Q3 2025, per quarter, actual building steadily rose at A$1.1bn, starts have surged to A$2.4bn but all eyes on the work yet to be done (WYTBD) at A$7.3bn. WYTBD are committed, approved developments that are expected to proceed in the next year. While not all will go through, a significant proportion is expected to be developed. The Q3 data for starts is also indicative of the possible pathways. It may not be a smooth process; delays can be expected. These represent a powerful rise in the sector. Mapped against the overall economy though, it may be smaller. The datacentre WYTBD is around 0.25% of nominal GDP at this stage. There have been numerous announcements regarding the pipeline for DC build commitments that will not be in the official ABS data.
If we assume the A$7.6bn increase, then deflate by target inflation, the rise in real private non-residential capital expenditure is an admirable 20%. Assuming it isn't implemented all at once and smooth the spend over multiple years, this would imply an approximate 0.4 percentage point rise in the contribution to real GDP per year. This is not to be ignored, but equally it doesn't suggest another boom period. However, if the media announcements are to be believed, there is a long-term pipeline of around A$150bn. If, and this is a big assumption, this comes about, then there could be a significant contribution to real GDP over a decade. This includes spending on the inputs, such as energy and water, as well as software. There are challenges to the projected implementation of datacentre construction. There has been a crowding out of construction as the public sector utilised available labour and inputs to building, creating roadblocks to rapid build out in the private sector. This will ease as the public build moderates. Energy and Transmission Energy is significant for DC and AI. DC are energy intensive and have huge energy, and thus transmission, needs. Increasingly, DC are saying they will provide their own energy, predominantly through renewables. The electricity building on WYTBD is larger than that of DC, and while AI and DC are a large part of this, the changing needs of the entire energy sector is also behind the ramp up. The WYTBD now equates to just shy of 3% of GDP on a nominal basis. Much of the acceleration since 2024 has been in the public sector, while private plans have been flat, after a sharp rise though 2022-2023. That will need to change if private energy generation is to be used to meet the new AI needs. Given the increasing focus on the social aspect of energy, and water, usage, often referred to as the energy trilemma of reliability, affordability and sustainability, combined with tight supply and rising costs, it should be expected that heavy users such as DC, and others, will meet their energy needs outside of the public provision. This can be represented as a capital expenditure tailwind, or an investment headwind. It is likely there is a bit of both. Some investors will be able to go ahead with private access to their energy, and water, needs. Others will see the costs, delays and social license as too high a barrier. Spending on actual AI itself will likely increasingly factor into the equation. Overall software spend has already surpassed the late 1990's boom and should further increase. As AI becomes cheaper per user, and other versions appear, this growth may slow. The generalised rise in overall spend thus far is also likely to represent the increased digitisation of lives and workforces that was already underway. AI adds to this. We would consider the contribution to growth to maintain on a steady path from here. Views as at 1 February 2025. |
|
Funds operated by this manager: Janus Henderson Australian Fixed Interest Fund , Janus Henderson Conservative Fixed Interest Fund , Janus Henderson Diversified Credit Fund , Janus Henderson Global Natural Resources Fund , Janus Henderson Tactical Income Fund , Janus Henderson Australian Fixed Interest Fund - Institutional , Janus Henderson Conservative Fixed Interest Fund - Institutional , Janus Henderson Cash Fund - Institutional , Janus Henderson Global Multi-Strategy Fund , Janus Henderson Global Sustainable Equity Fund , Janus Henderson Sustainable Credit Fund All opinions and estimates in this information are subject to change without notice and are the views of the author at the time of publication. Janus Henderson is not under any obligation to update this information to the extent that it is or becomes out of date or incorrect. The information herein shall not in any way constitute advice or an invitation to invest. It is solely for information purposes and subject to change without notice. This information does not purport to be a comprehensive statement or description of any markets or securities referred to within. Any references to individual securities do not constitute a securities recommendation. Past performance is not indicative of future performance. The value of an investment and the income from it can fall as well as rise and you may not get back the amount originally invested. Whilst Janus Henderson believe that the information is correct at the date of publication, no warranty or representation is given to this effect and no responsibility can be accepted by Janus Henderson to any end users for any action taken on the basis of this information. |

fashion, driven by geopolitical concerns over Greenland,
Venezuela and Iran. (2-minute read)
17 Feb 2026 - Glenmore Asset Management - Market Commentary
|
Market Commentary - January Glenmore Asset Management February 2026 (2-minute read) Global equity markets kicked off the new year in volatile fashion, driven by geopolitical concerns over Greenland, Venezuela and Iran. This provided a boost to Resources, which drove the ASX All Ordinaries Accumulation Index up +1.6% for the month. This represented a slight outperformance vs the S&P 500, which rose +1.4%. However, the NASDAQ underperformed most global benchmarks (+0.9%), as fears over disruption caused by Artificial Intelligence (AI) weighed upon the Tech sector. Outside of the US, the FTSE 100 and Euro Stoxx 50 continued their strong run, rising +2.9% and +2.7%, respectively. The ASX experienced a particularly volatile month, which was more pronounced in the small-cap segment of the market. Energy and Gold were the strongest performing sectors, whilst Technology was the weakest performer, impacted by concerns about AI disruption. During the month, the ASX Small Ordinaries Accumulation Index rose +6.0% at its peak, before falling over -3% in the final week of the month, to finish +2.7% higher. In addition to the factors noted above, we believe the small-cap segment was disproportionately impacted by two events, being (1) stronger-than-expected Australian inflation data, which supported the RBA's subsequent February 2026 rate increase, and (2) a sharp reversal in commodity prices following the appointment of Kevin Warsh as the new Governor of the US Federal Reserve. Regarding monetary policy in Australia, the market expects 1- 2 more RBA rate hikes over the next 12 months. In bond markets, the US 10-year bond yield rose +7 basis points (bp) to 4.24%, whilst its Australian counterpart rose +7bp to 4.81%. The Australian dollar had a strong month, rising +4.4% to US$0.70, implying an increase of 2.9 cents. Funds operated by this manager: |