News

Performance Report: Bennelong Emerging Companies Fund
The Bennelong Emerging Companies Fund rose by +0.03% in January. Since inception in November 2017, the fund has returned +18.49% per annum, an outperformance of +9.39% relative to the ASX 200 Total Return benchmark, which has returned...
Read more...

2025 Responsible Investment and Stewardship Report
This report outlines how sustainability considerations are integrated into company analysis, engagement, proxy voting and portfolio decision-making across the global infrastructure universe.
Read more...

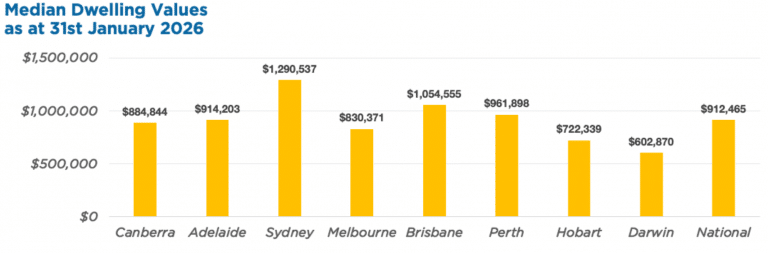
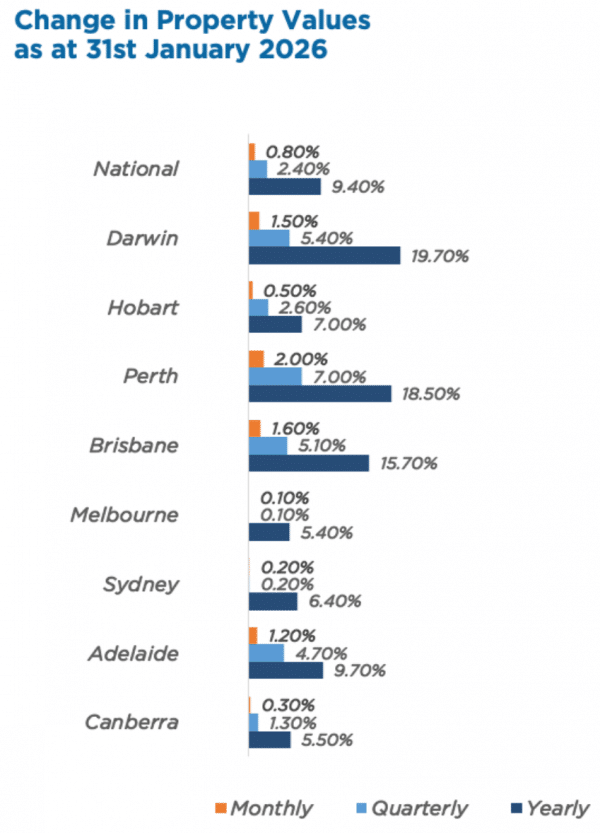
Australian Secure Capital Fund - Property Update
House prices bounced back in January after a slower December, rising by 0.8% nationally. After slight falls last month, values in Melbourne and Sydney rebounded, while Brisbane, Adelaide, Perth, and Darwin all saw increases of 1.2% or...
Read more...

Performance Report: Altor AltFi Income Fund
The Altor AltFi Income Fund rose by +1.32% in January, outperforming the RBA Cash Rate + 5% benchmark by +0.63%. Since inception in April 2018, the fund has returned +11.53% per annum, an outperformance of +4.45% relative to the benchmark...
Read more...

Hedge Clippings |20 February 2026
With yesterday's continued strong employment figures giving no respite to inflationary pressures, it reinforces the view that interest rates are going to be on hold (at best), or on an upward path over the next six months (at worst)....
Read more...

Performance Report: Seed Funds Management Financial Income Fund
The Seed Funds Management Financial Income Fund rose by +0.71% in January, outperforming the Solactive Australian Hybrid Securities (Net) benchmark by +0.54%. Since its inception in October 2015, the fund has returned +6.44% per annum, an...
Read more...
Performance Report: Bennelong Twenty20 Australian Equities Fund
The Bennelong Twenty20 Australian Equities Fund rose by +2.12% in January, outperforming the ASX 200 Total Return benchmark by +0.34%. Since inception in November 2009, the fund has returned +9.13% per annum, an outperformance of +0.71%...
Read more...

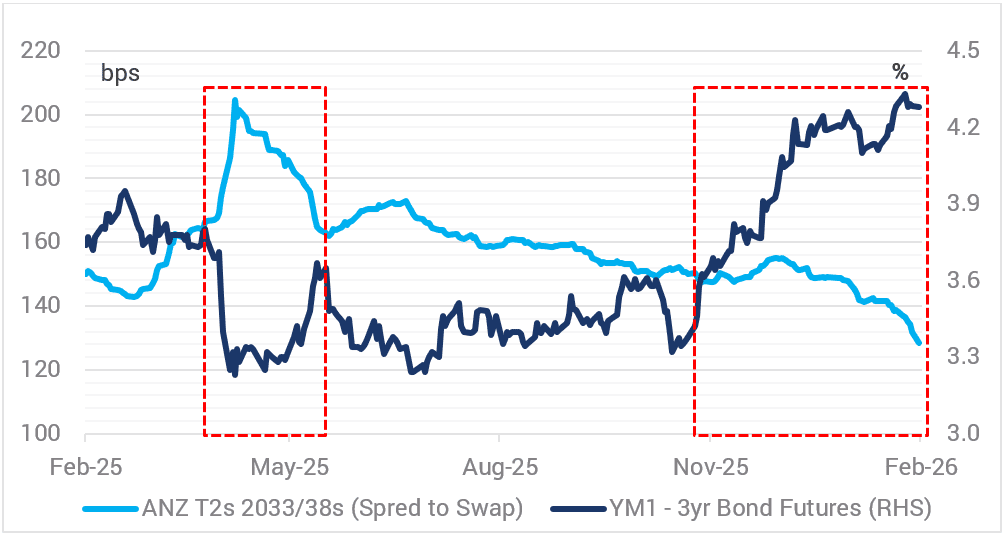
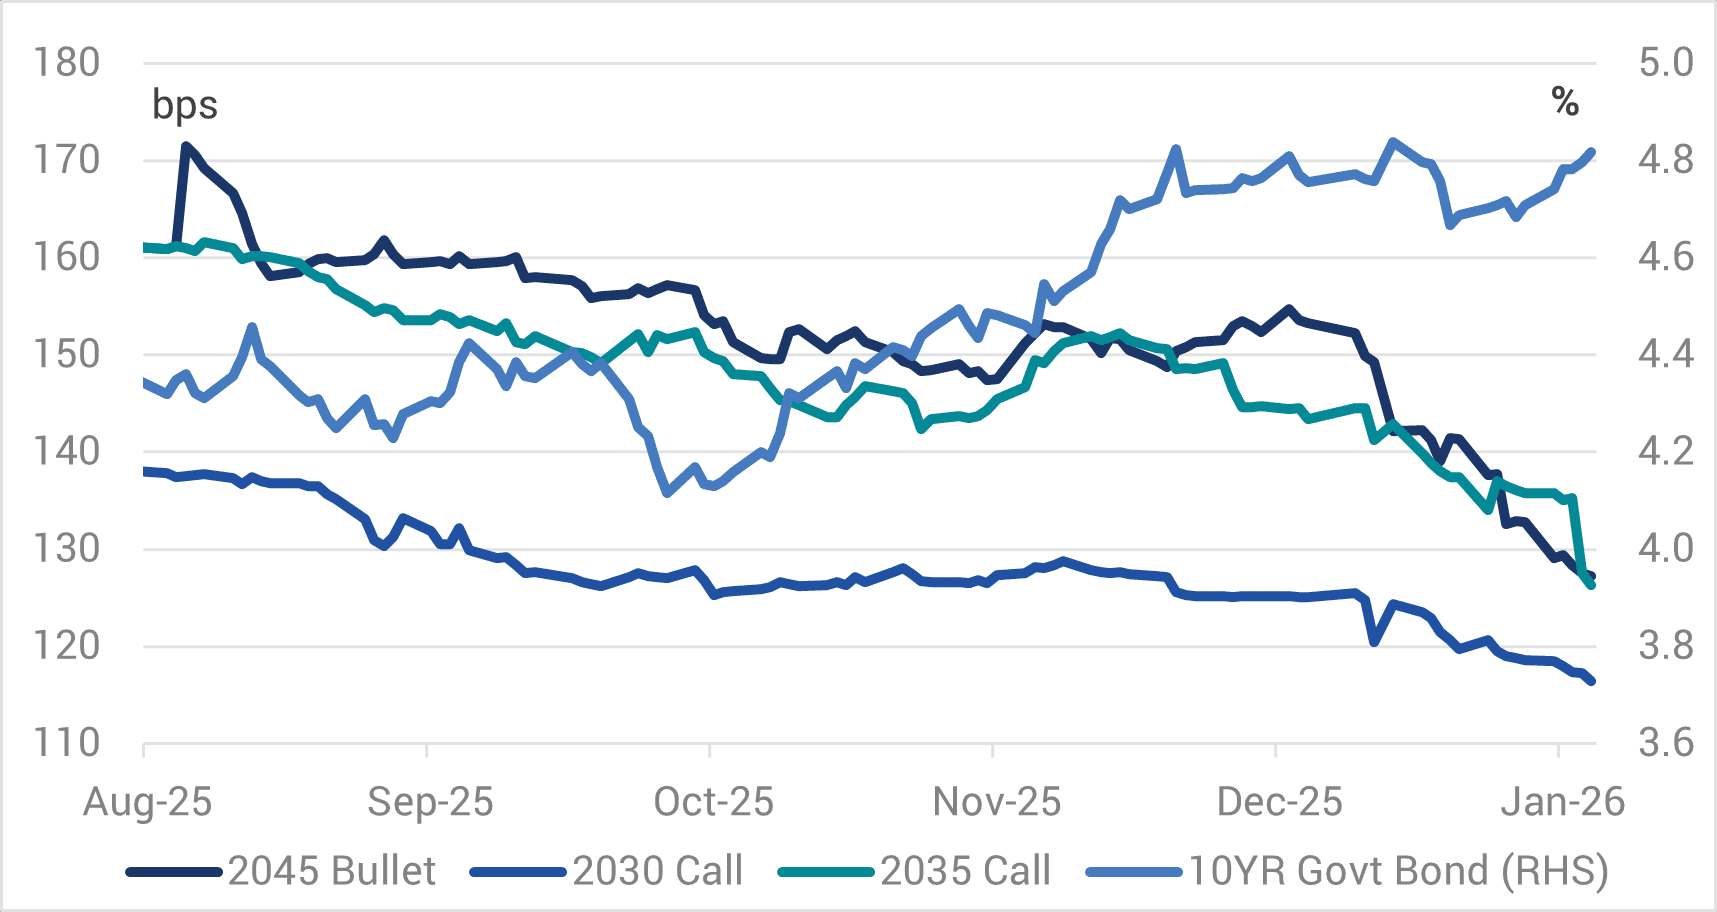
Volatility providing fertile ground in active credit
When volatility emerges and markets inevitably change course, risks and opportunities reset, with one investor's new opportunity another's pitfall. This is the essence of a dynamic market and why Phil Strano (Head of Australian Credit...
Read more...

Performance Report: DS Capital Growth Fund
The DS Capital Growth Fund has returned +12.19% per annum since its inception in January 2013, an outperformance of +2.83% relative to the ASX 200 Total Return benchmark, which has returned +9.36% on an annualised basis over the same period.
Read more...

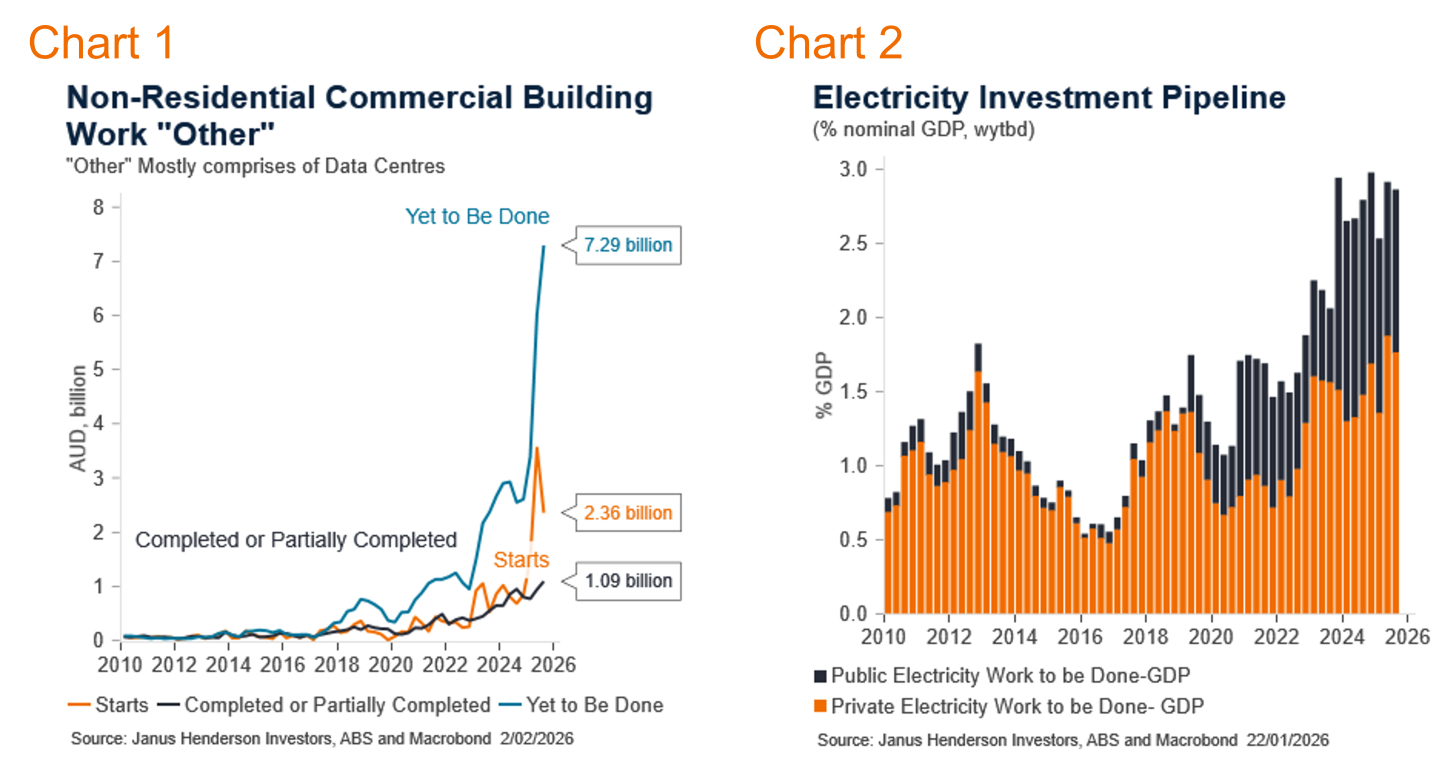
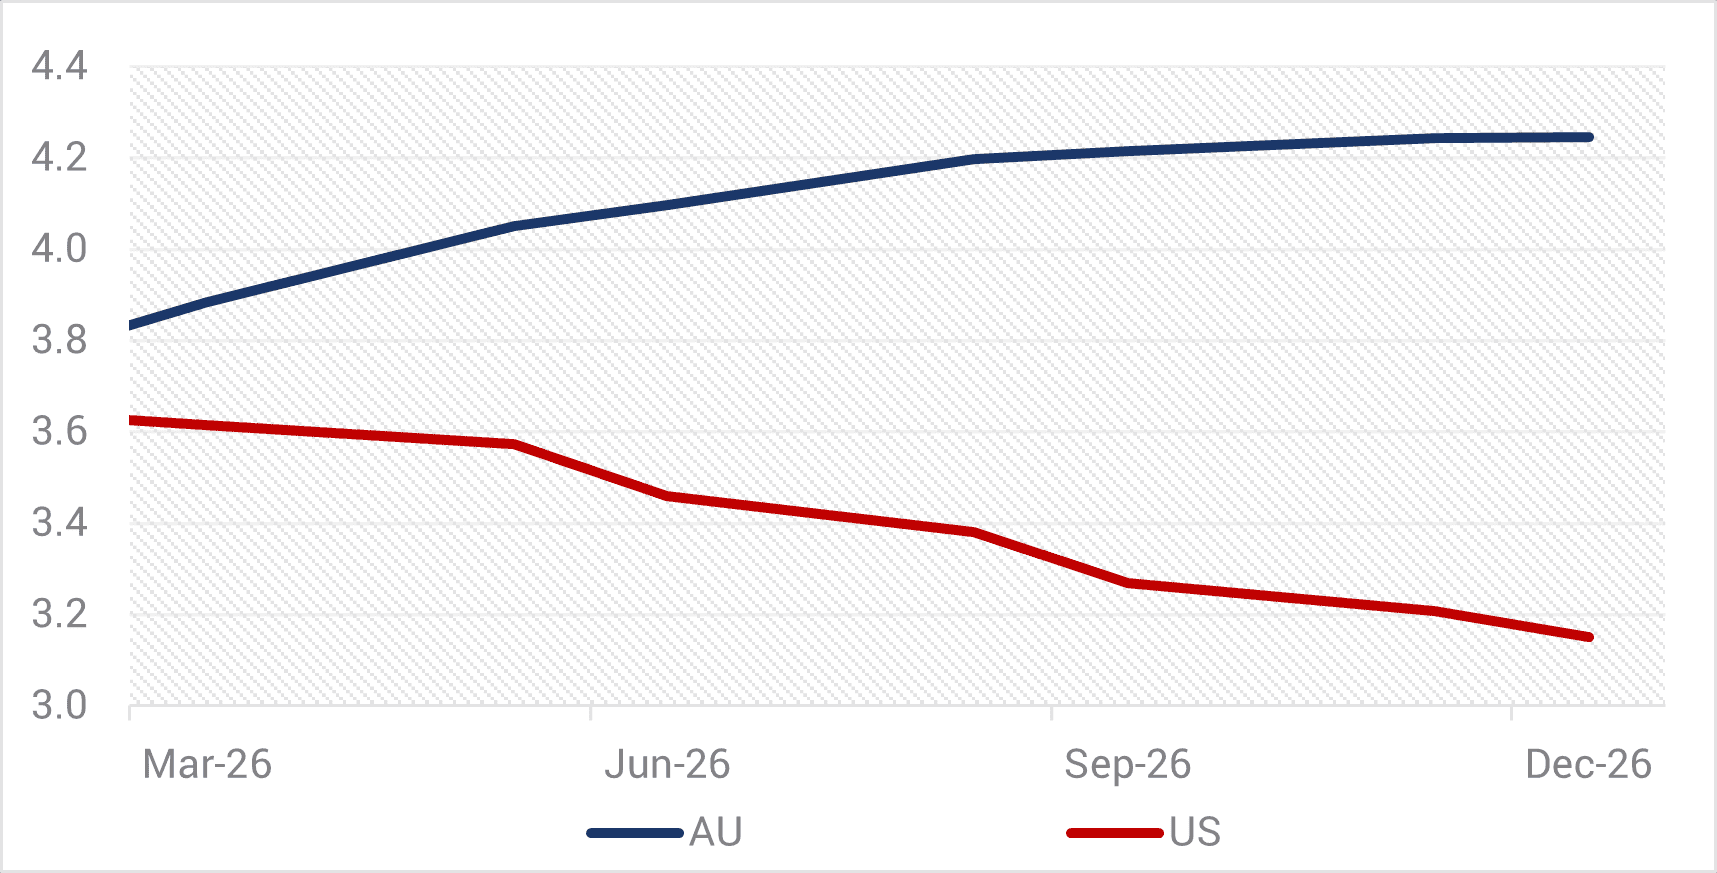
Australian economic view - February 2026
Emma Lawson, Fixed Interest Strategist - Macroeconomics in the Janus Henderson Australian Fixed Interest team, provides her Australian economic analysis and market outlook. (7-minute read)
Read more...