|
A few charts from our Micro Caps CY2024 Overview Equitable Investors February 2024 CY2023 Review
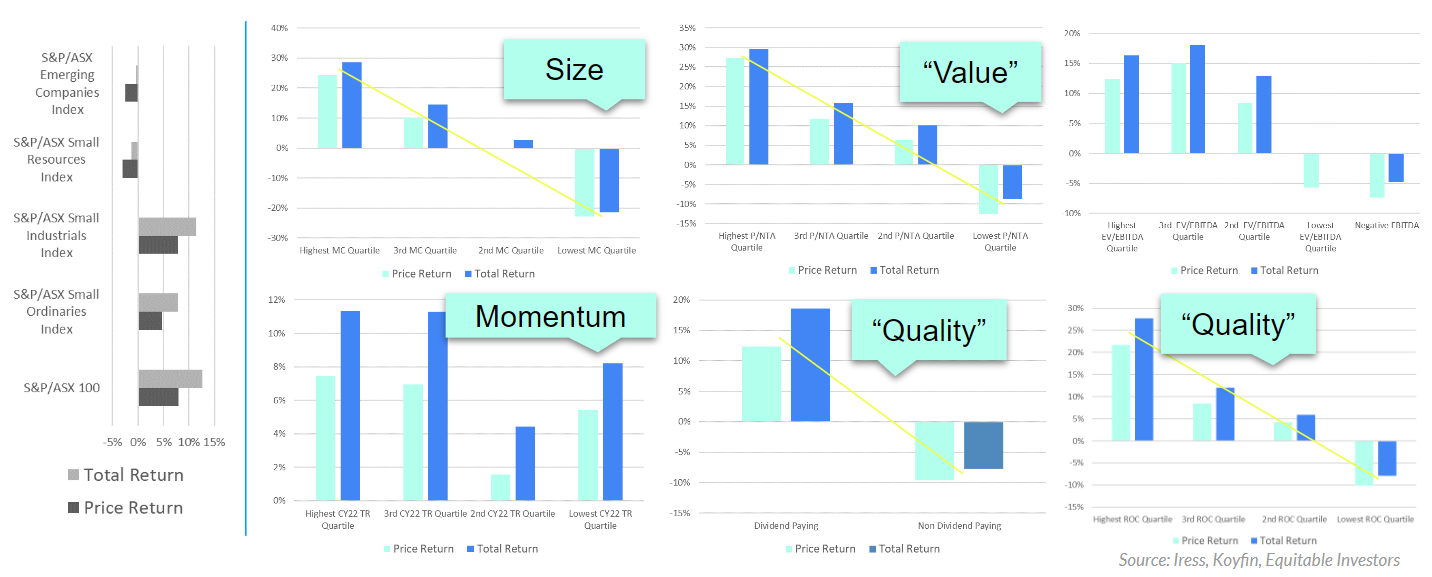
Stocks on higher multiples did better than those in "value" territory as investors chased "quality" (if you define that as top quartile return on capital or companies paying dividends) but the most clear cut divide in ASX listings in CY2023 was simply size as investors shunned the perceived heightened risk of micro caps. Below we analyse CY2023 performance of our ASX "FIT" (Financials, Industrials & Technology) micro-to-mid cap universe, alongside the S&P/ASX benchmarks. All FIT returns presented are averages of the stocks that meet the relevant criteria. CY2023 Sector & Industry Review
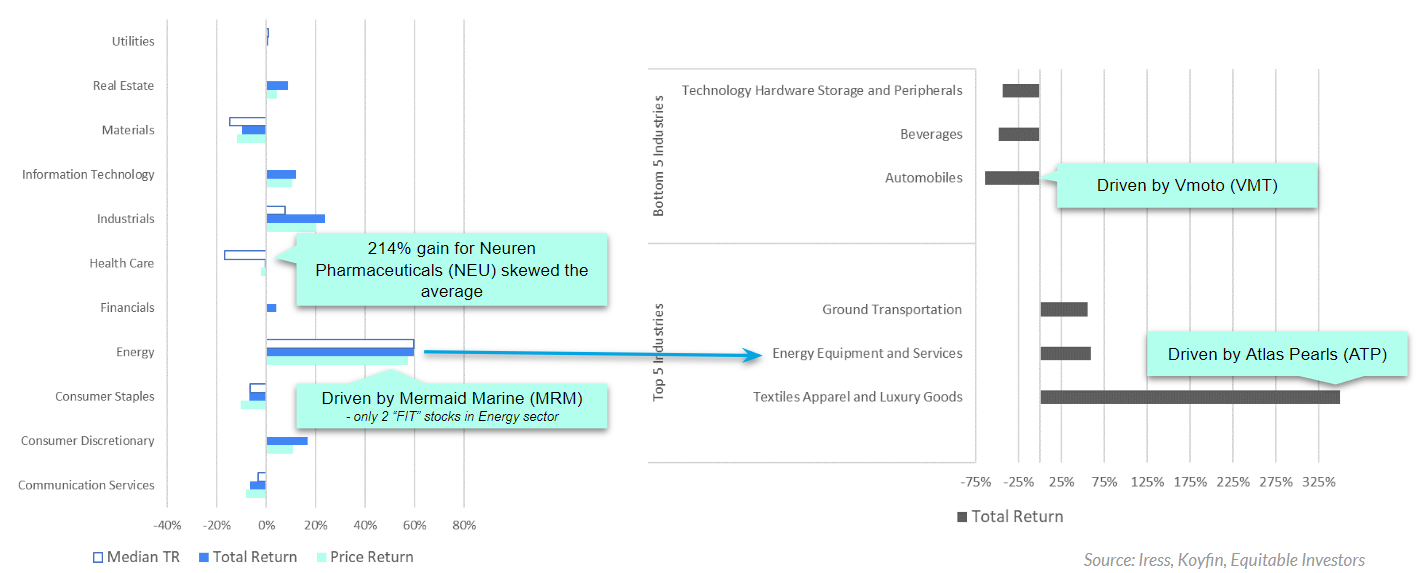
The Materials sector, covering chemicals, packaging and paper, was the most beaten-down in CY2023 with an average decline of 10% and a median decline of 15%. Health was an interesting space, where the average return was -1% but the median was -17% as the median biotech, pharmaceutical and health care stock fell by more than 20% BUT one stock surged 214%. Interesting to note that Consumer Discretionary stocks strongly outperformed Consumer Staples.
Returns by Size - Broader International Perspective
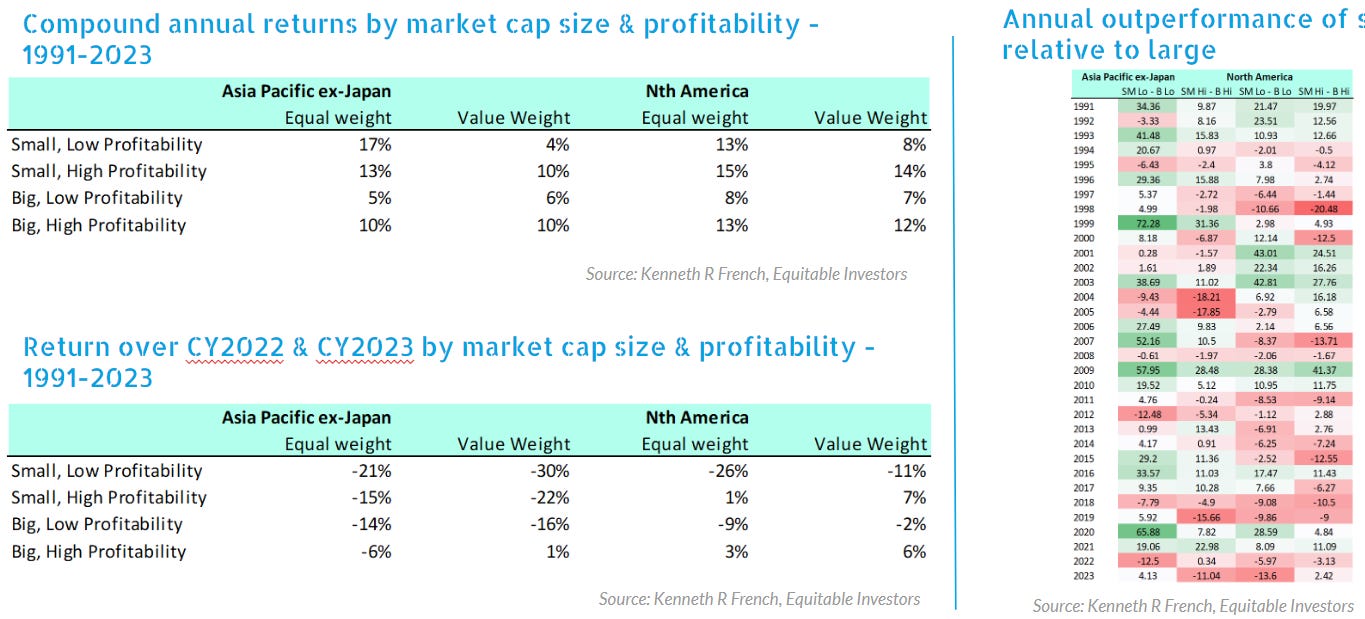
On an equal-weighted basis, the smallest 10% of stocks by market cap have outperformed the larger 90% in North America and in Asia Pacific ex-Japan (Australia, Hong Kong, NZ & Singapore) over the past 30+ years. But returns over CY2022 and 2023 have favoured the largest and most profitable businesses.
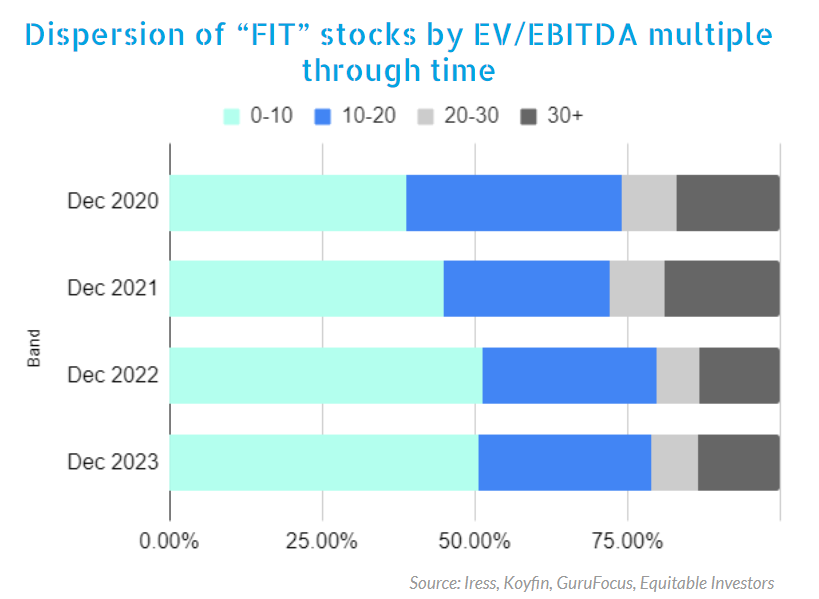
We began tracking the dispersion of trailing (historical) EV/EBITDA multiples when we launched the weekly "Small Talk" publication in 2020. There has been a tangible shift downwards in multiples, with 51% of companies on 10x or less in 2022 and 2023, compared to just 39% at the end of 2020. Funds operated by this manager: Equitable Investors Dragonfly Fund Disclaimer Past performance is not a reliable indicator of future performance. Fund returns are quoted net of all fees, expenses and accrued performance fees. Delivery of this report to a recipient should not be relied on as a representation that there has been no change since the preparation date in the affairs or financial condition of the Fund or the Trustee; or that the information contained in this report remains accurate or complete at any time after the preparation date. Equitable Investors Pty Ltd (EI) does not guarantee or make any representation or warranty as to the accuracy or completeness of the information in this report. To the extent permitted by law, EI disclaims all liability that may otherwise arise due to any information in this report being inaccurate or information being omitted. This report does not take into account the particular investment objectives, financial situation and needs of potential investors. Before making a decision to invest in the Fund the recipient should obtain professional advice. This report does not purport to contain all the information that the recipient may require to evaluate a possible investment in the Fund. The recipient should conduct their own independent analysis of the Fund and refer to the current Information Memorandum, which is available from EI. |