|
When it's good to be bad Ophir Asset Management February 2022 |
|
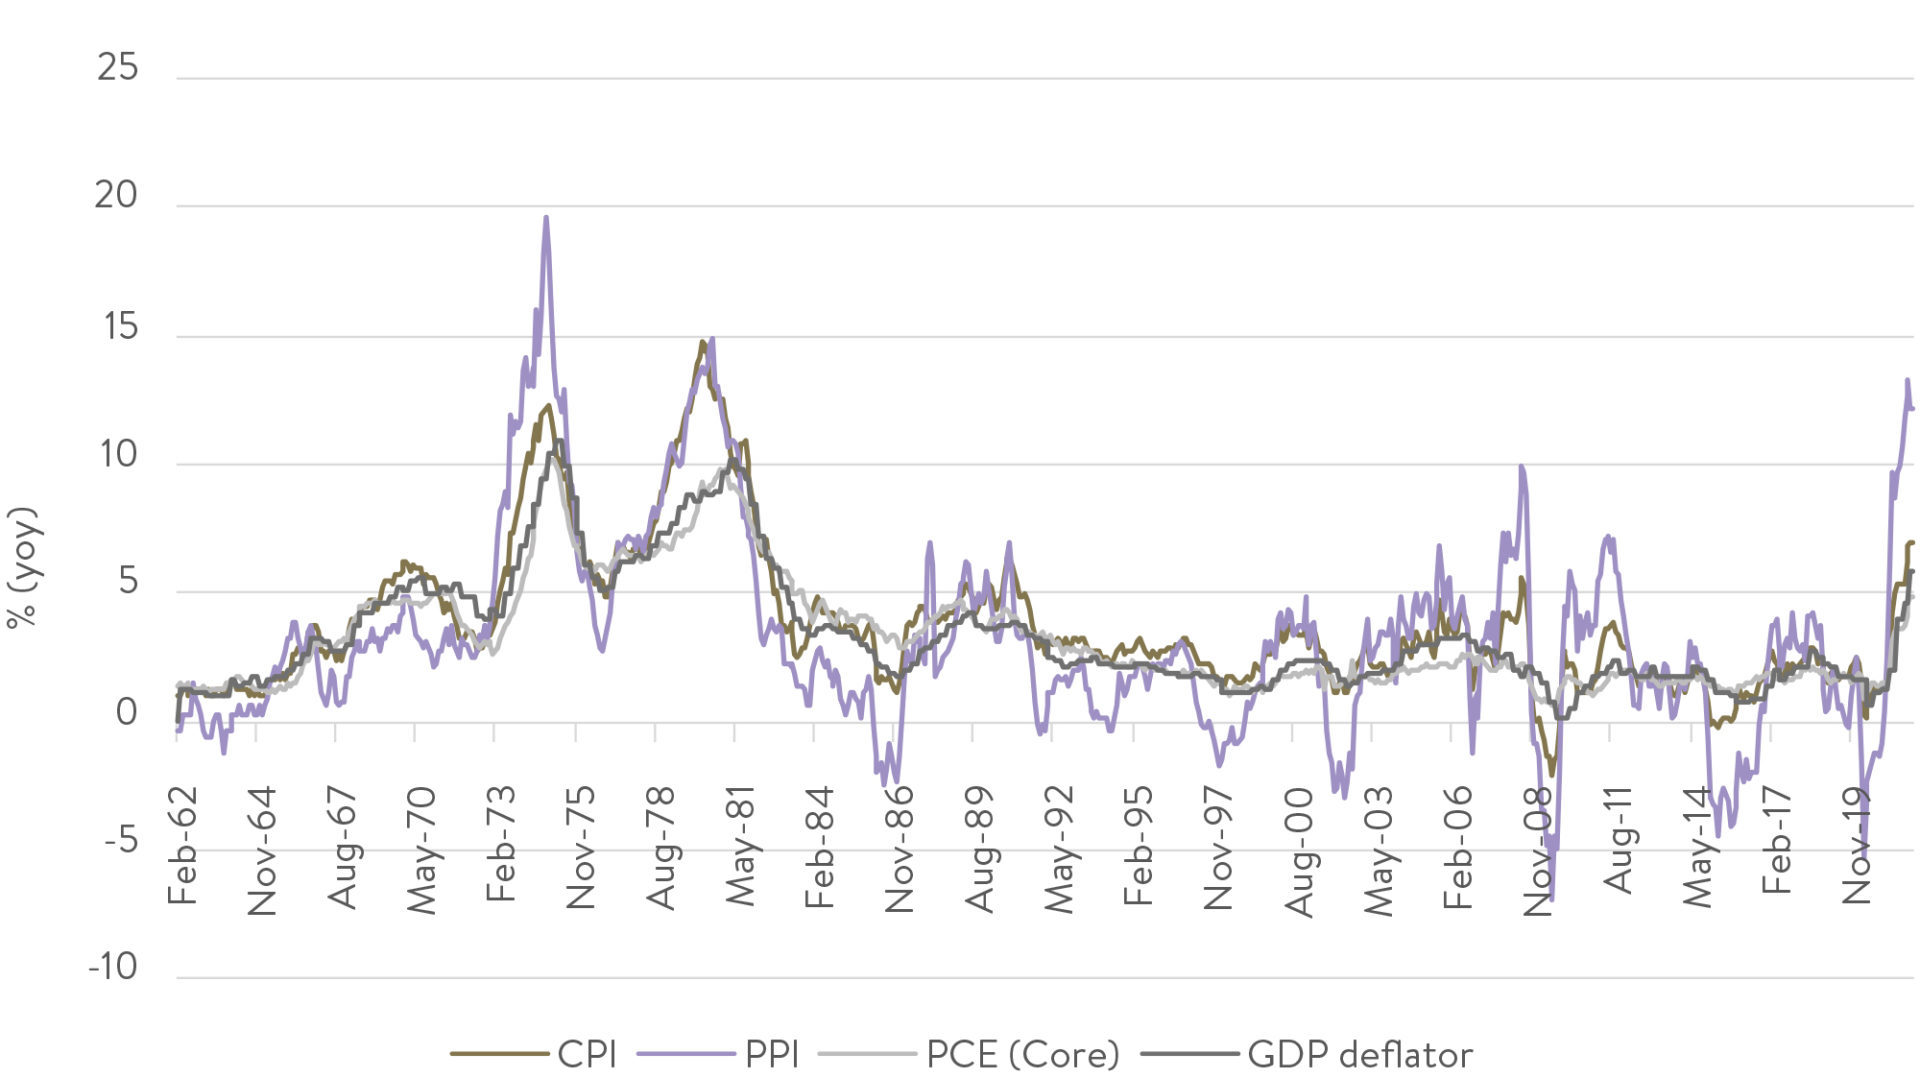
Inflation 'Persistently transitory'? You'd have to be buried under a rock of late, or thoroughly disinterested in the news of the day, to not know that inflation is back. And back in a big way! Many young people today in developed economies haven't known what an inflation problem is. They've only known low interest rates that have been great for leveraging into investment properties. But COVID-19 has changed all that. Below we show various different inflation measures in the US, the world's still-largest economy. CPI, or Consumer Price Inflation, is the one heard most by investors and it is currently at 7%, well above the US Federal Reserve's 2% target. US inflation (yoy)
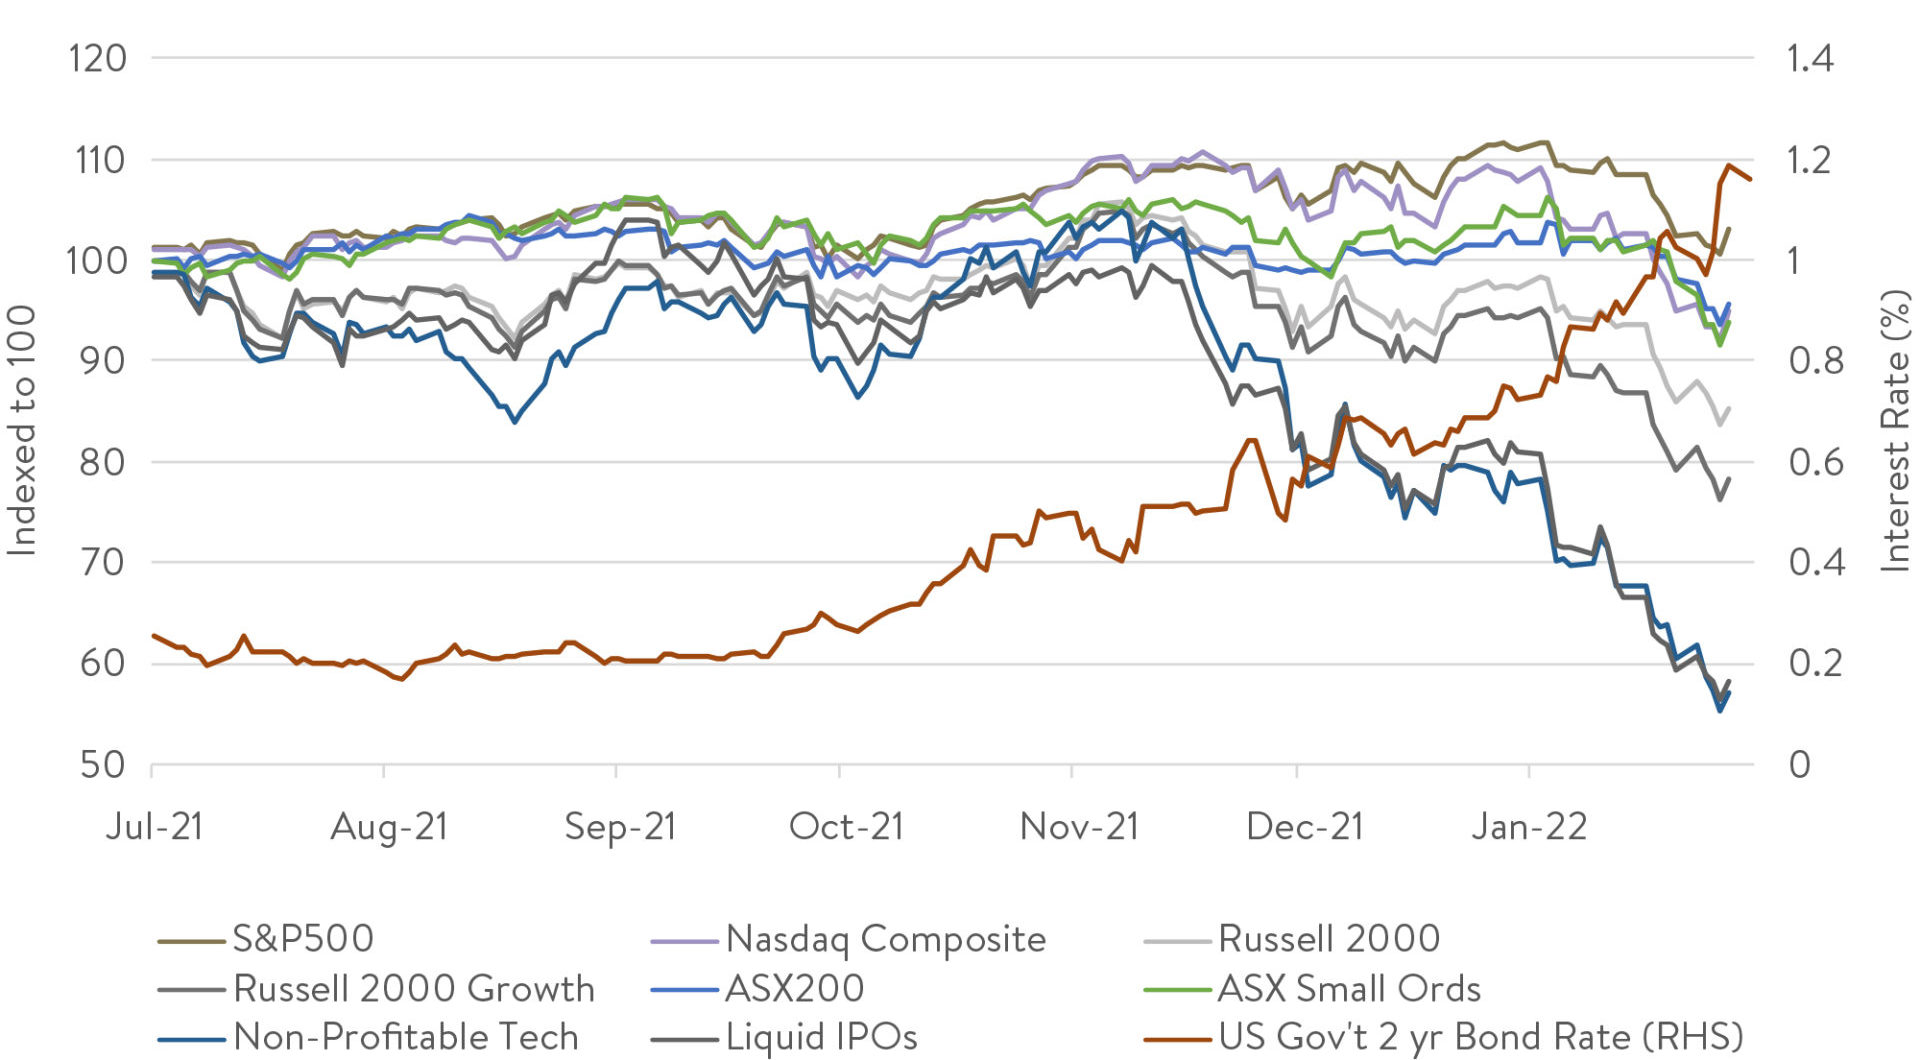
Source: Ophir, Factset Why is this? Well, looking at the components that make up CPI, it is clear it's high mainly because (government boosted) demand for goods by locked up households during COVID-19 has greatly outstripped supply, pushing up their prices. CPI is likely to wane in the second half of 2022 as households spend their government cheques and supply catches up. But with low unemployment levels and wage pressure starting to build, it's no longer appropriate for the Fed to be engaging in quantitative easing (QE) and keeping interest rates at 0%. For much of 2021, the Fed had been telling the market that inflation was likely to be quite transitory, but late last year fessed up that it was behind the eight ball and that inflation was likely to be more persistent. This has seen it stage a 180-degree turn that Fred Astaire would be proud of, changing its tune to a rapid exit from QE and bringing forward rate hikes from expected rises starting in 2024 to March 2022. A bomb is detonated under small-cap growth This about-face has seen a rapid lift in both short-term and long-term interest rates. You can see an example of this below with 2-year US government bond yields (red line) rising rapidly from November last year onwards as markets priced in Fed rate hikes. A veritable bomb was then set off under parts of the share market most vulnerable to higher interest rates, particularly long-term interest rates. Those parts most impacted are those where more of their cash flows are earned farther out into the future, such as more growth-orientated businesses. This occurs because when you value a business, higher long-term interest rates disproportionately reduce the present value of profits earned further out into the future. Small cap growth underperforms recently as markets price in higher interest rates
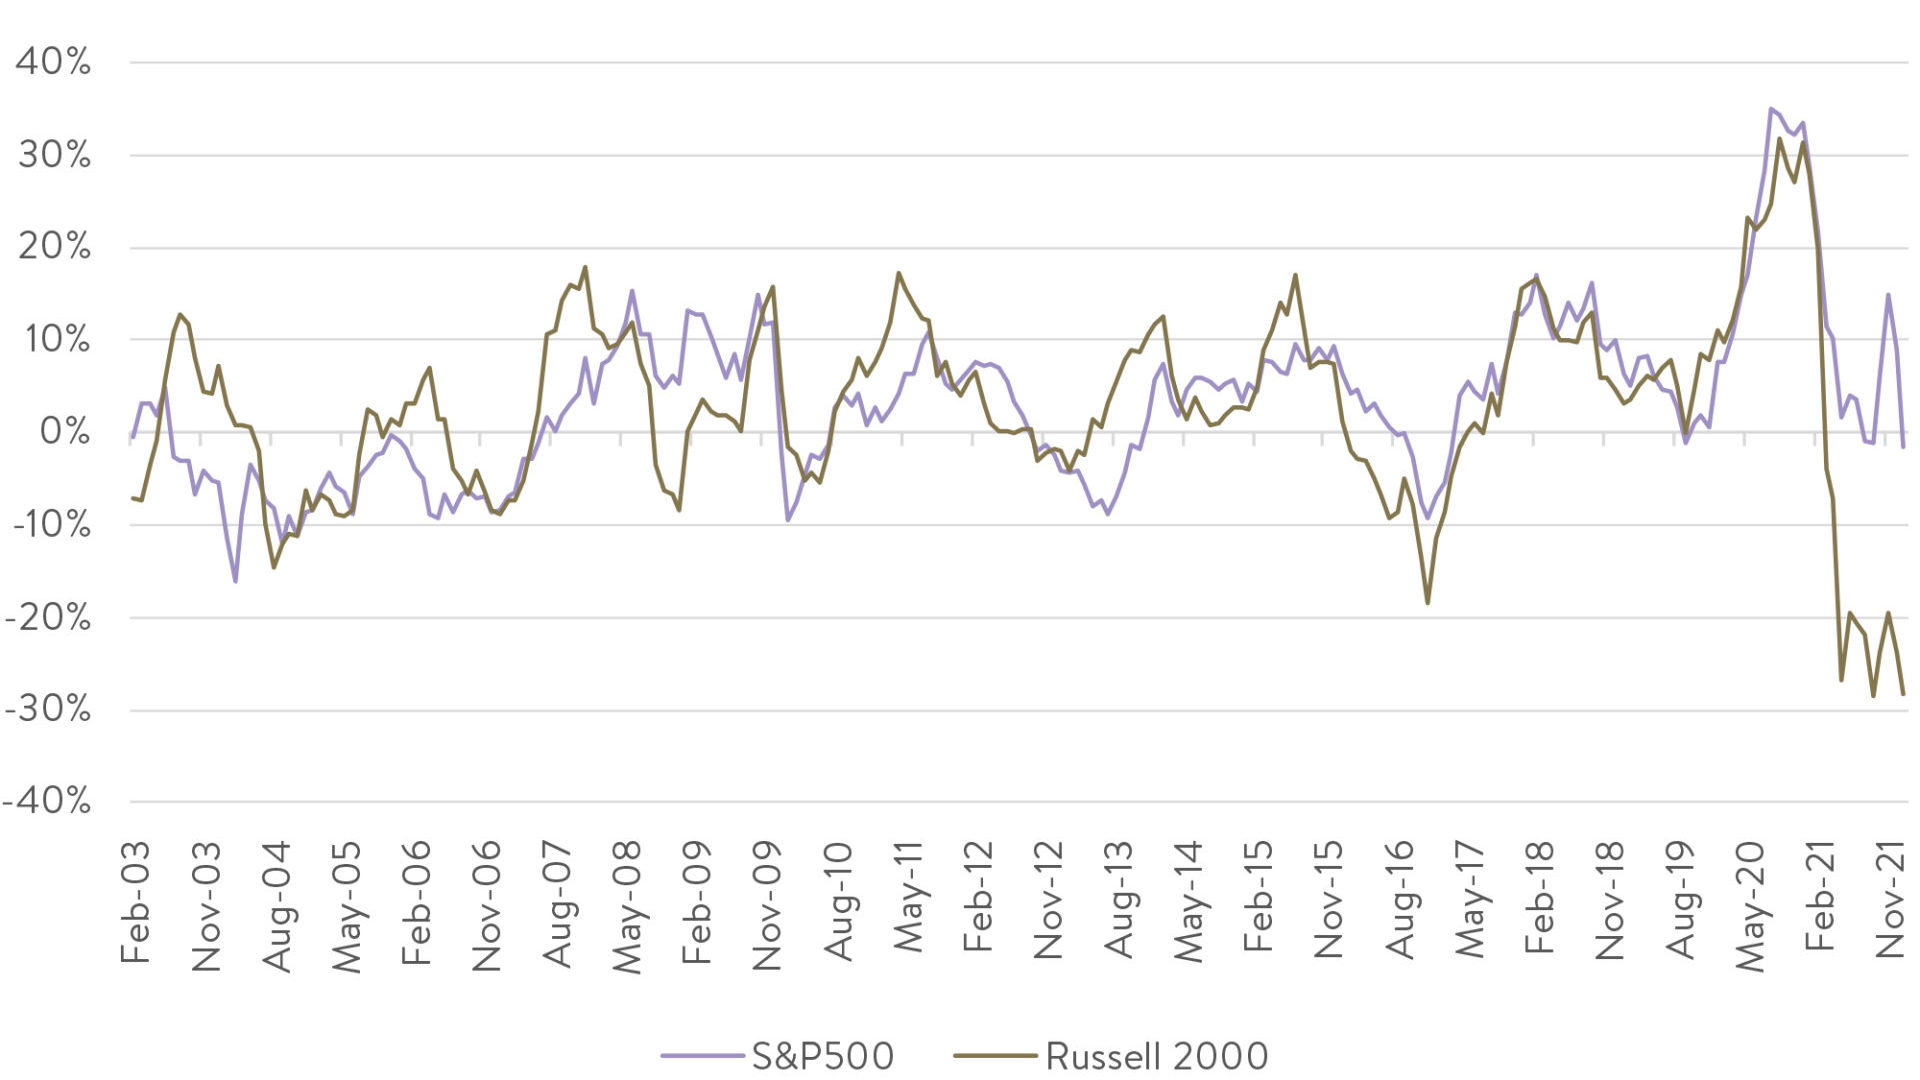
Source: Ophir, Factset Two of the most growth-orientated parts of the share market in the US, non-profitable technology business and recent IPOs have been savaged over the last three months - falling over 50%+ at the time of writing. At the other end of the spectrum, large caps via the S&P500 held up better, down only around -5% in January and only circa -7% since its 2021 highs. Looking at US small caps, as proxied by the Russell 2000 Index, they are down around -19% at writing from their 2021 highs. Whilst the Russell 2000 Growth Index, which looks at the faster-growing part of the small-cap market that we invest into, is down around -26%, well and truly into bear market territory. Interestingly the Russell 2000 Growth Index in January underperformed its Russell 2000 Value Index counterpart (of more mature, slower growing but cheaper businesses) by the second most in a month since the early 2000's tech wreck over 20 years ago. Perhaps even more eye-popping is the fact that over the last year that same growth index easily underperformed value by almost -30% - the most again in over 20 years! This is shown quite clearly in the gold line in the chart below. Normally this growth versus value under- or out-performance is mirrored in the large-cap part of the market (S&P500). But this period has been an extreme outlier. Quite simply this is because the growth-orientated stocks in the large-cap part of the market, such as the FAANG's, have seen their share prices hold up better to the end of January. Growth v value (yoy)
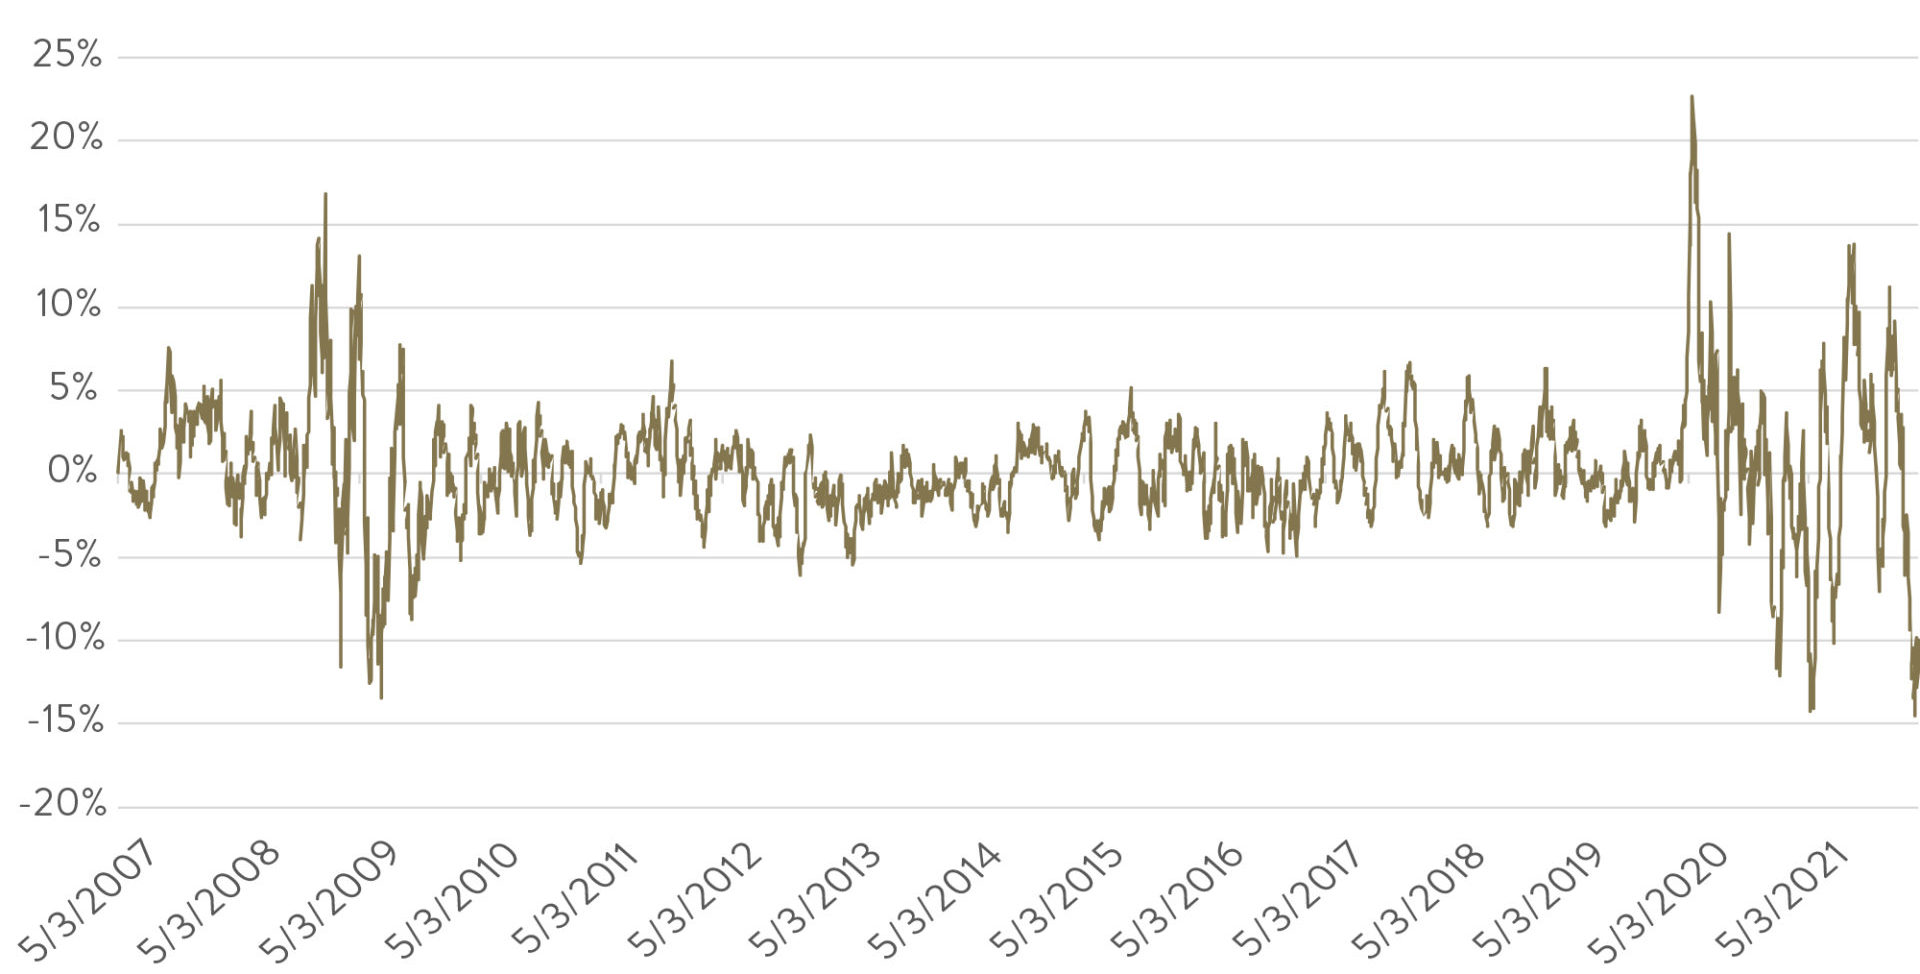
Source: Ophir, Factset This has also been reflected in the sector returns in US and also Australian small caps. The value-orientated sectors such as utilities, real estate, energy and materials (and also financials in the case of the US) have held up much better over the last three months. The sectors where you tend to find more growth-orientated businesses, such as IT, healthcare and consumer discretionary, have severely underperformed. Long-time investors will know that we tend to have larger allocations to businesses in our funds in those more growth-orientated sectors; and are underweight, or often have no allocation to the more value orientated sectors, particularly utilities and real estate. Why is this you may ask? Utilities and real estate companies tend to have inflation-linked cash flows that are relatively steady and contracted in nature, which makes the job harder for us to get an edge on the market pricing those cash flows. Moreover, they tend to have higher levels of debt, as do many 'value' type businesses which are more mature and whose more stable earnings make it easier to lend against. We generally avoid the most indebted companies because they can often get into trouble during an economic downturn. We prefer those with little debt or net cash on their balance sheet which provides optionality for future growth. When it's good to be bad (and why we will not compromise our strategy) One unique characteristic of the market sell-off in January has been that companies with higher levels of debt and weaker balance sheets have actually tended to outperform. And not by a little! As the below chart shows, companies with strong balance sheets have underperformed those with weak balance sheets in the US to a degree not seen since March/April 2009. Back then it was because the US was emerging from the GFC and if you were a highly geared business with lots of debt (if you were still around) you were now more comfortable you were going to survive - so their prices rallied. Today it's because the value sectors tend to have the most debt and investors are also more comfortable highly indebted businesses who were at risk are going to survive COVID-19. GS Strong V Weak Balance Sheet (mom)
Source: Ophir, Factset
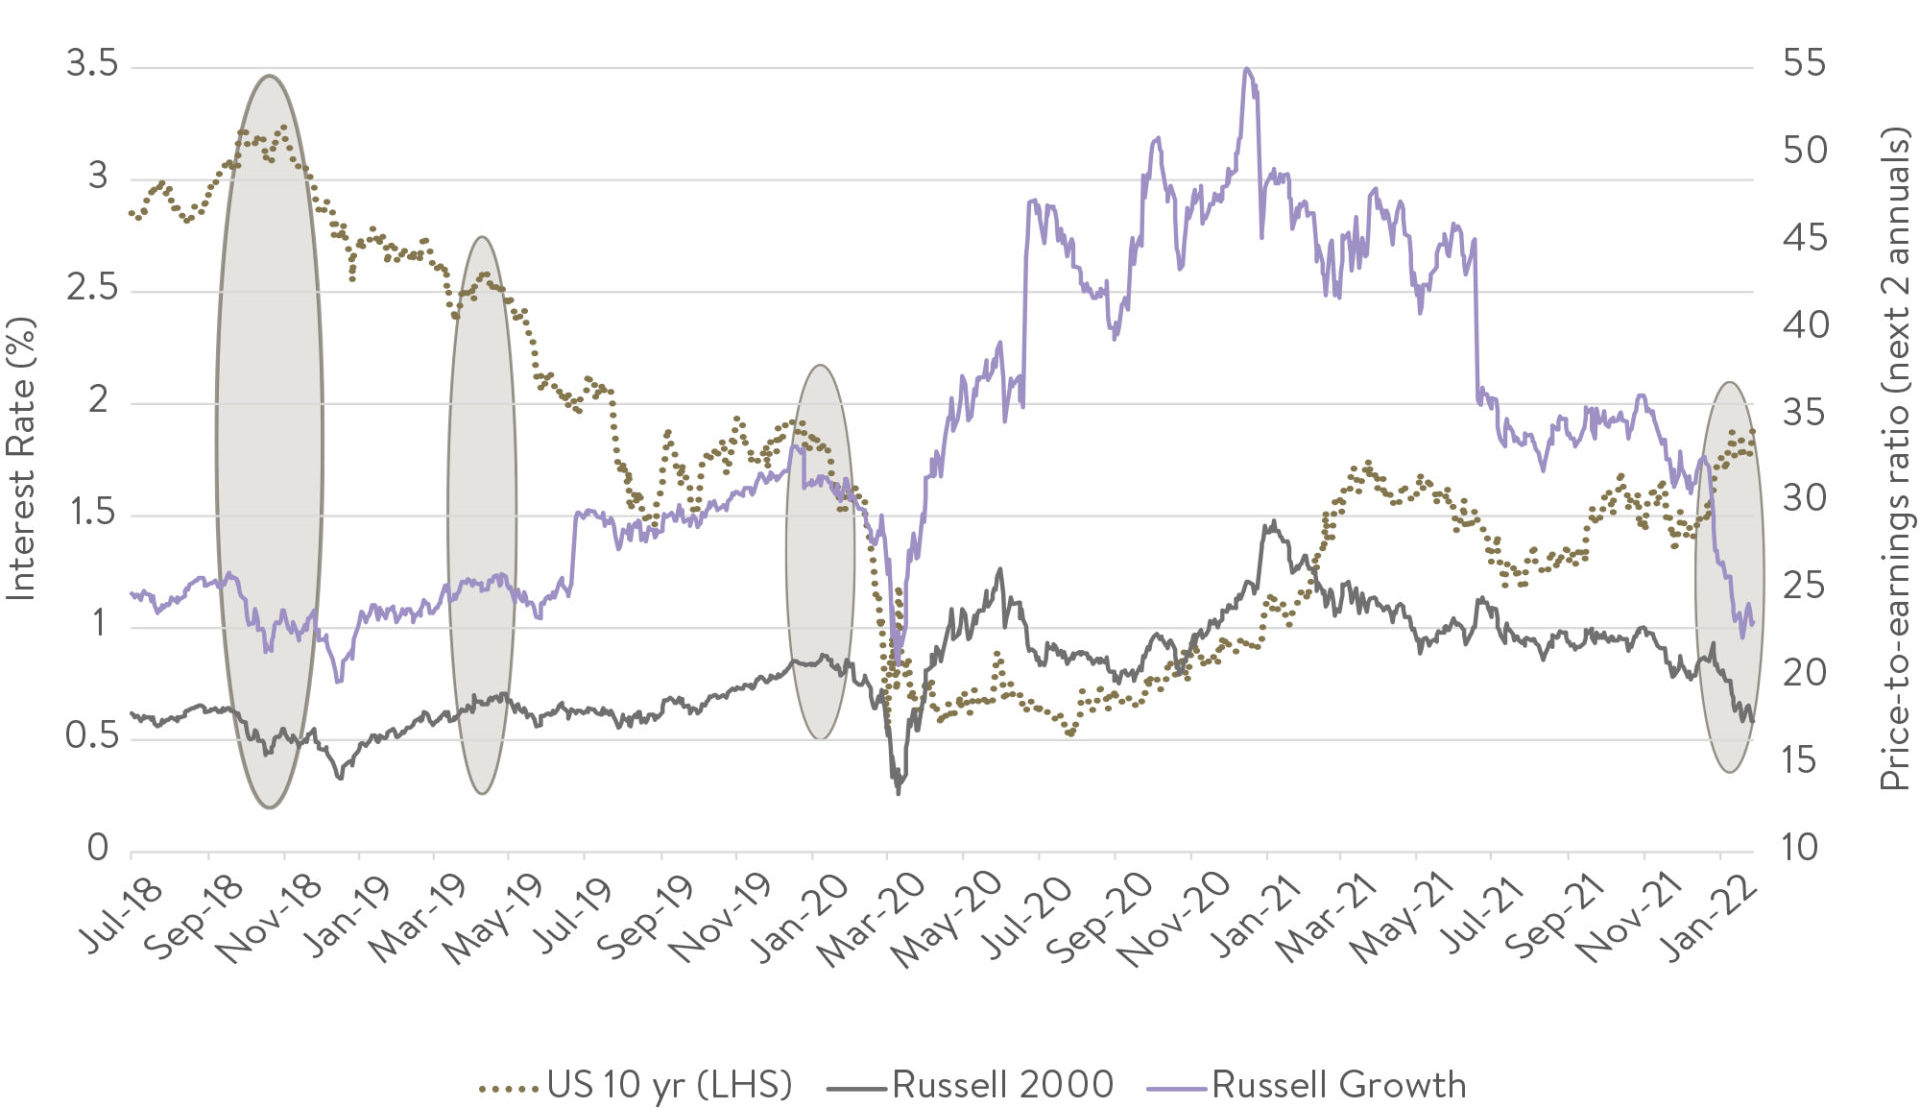
That is something we are not willing to do, and never will. Changing your spots as an investor to chase the flavour of the day has been the death knell for many funds management businesses and is a cardinal mistake. There is no doubt in hindsight that making such a radical change would have provided some short-term downside protection to our performance. However, in order to do so, aside from the impenetrable rule above of not changing our spots, we would have had to be able to correctly anticipate the change in the macroeconomic environment and the pivot from the Fed. That is one game we do not have an edge in. We are just as likely to be right there as we are to be wrong, with hundreds of thousands of professional investors parsing the daily macroeconomic tea leaves. We'd rather keep our performance reliant on the very detailed bottom-up work we do to understand the growth of small caps and how the market is pricing it - and where there is a comparative dearth of people looking. So, where to from here ... The $64 billion dollar question. One thing is certain: ultimately the market will be willing to pay up for companies that can display earnings growth. What we have seen that gives us some comfort that perhaps most of the de-rating of small growth-orientated companies may have occurred already, particularly in the US, is current valuations. In the chart below we show both the US 10-year government bond yield (the so-called global risk-free rate that is key to valuing businesses) and also the price-to-earnings ratios for the US Small Cap (Russell 2000) and US Small Cap Growth (Russell 2000 Growth) parts of the market. Valuation compression: rising interest rates
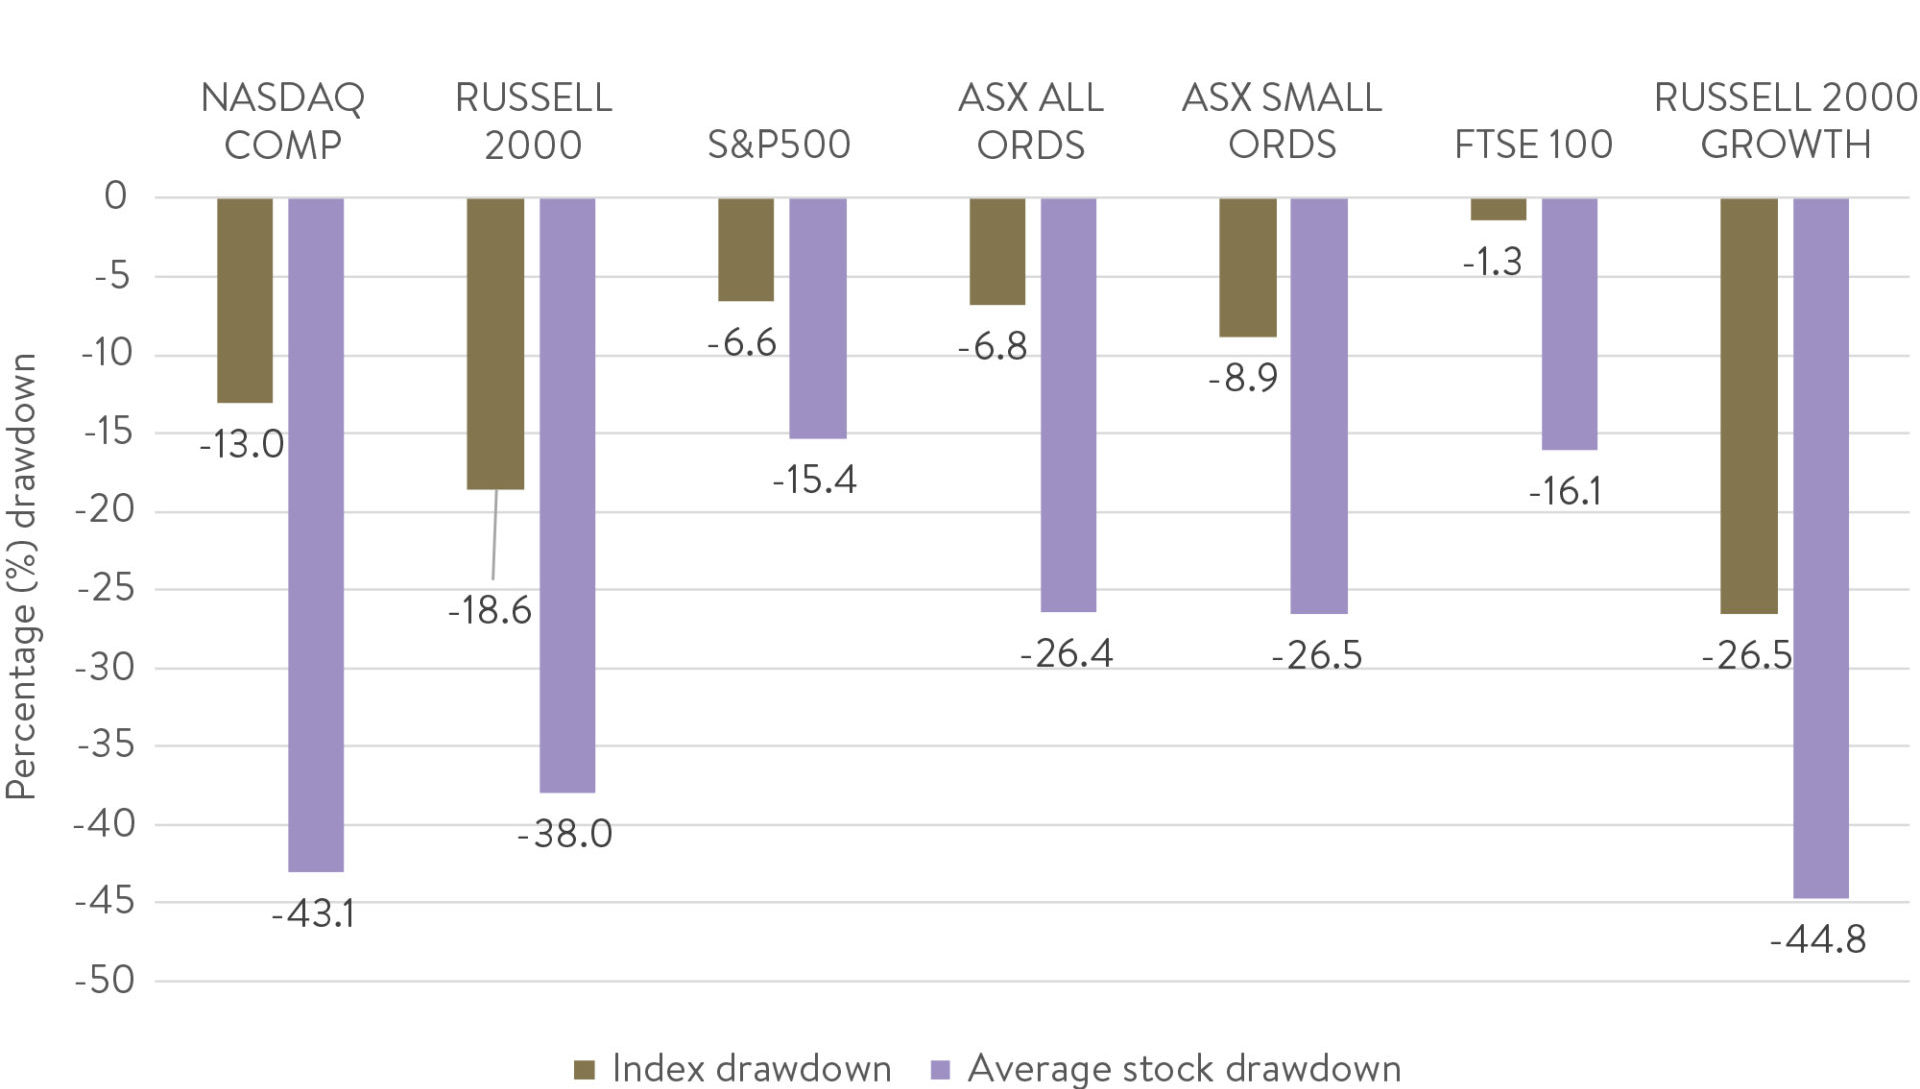
Source: Ophir, Factset What we can see is that the US bond yield is now back at the same levels (1.8-2%) as early 2020 just prior to COVID-19. But valuations (P/Es) for the Russell 2000 and Russell 2000 Growth parts of the share market are back down to levels seen in 2018 when the key US 10-year interest rate was much higher (3-3.5%). What this says to us is that falls in these parts of the share market are already factoring in much higher interest rates - and at the high end of what most strategists are forecasting over the next few years. Another measure that highlights the value that is emerging in US small caps is looking beyond the headline indices to how much the average stock has actually fallen. The below chart shows how much various headlines indices have fallen from their highs over the last year and compares it to how much the average constituent of that index has fallen. The average Russell 2000 and Russell 2000 Growth Index constituent is down a truly mammoth -38% and -45% respectively - far in excess of the headline index. How? Well, its partly because indices are market-cap weighted, so the biggest companies have a disproportionate influence on the index outcome and have fallen less. But for benchmark unaware active managers such as us, it is actually the average stock fall that is more indicative of the market we invest into. The bear is on the loose
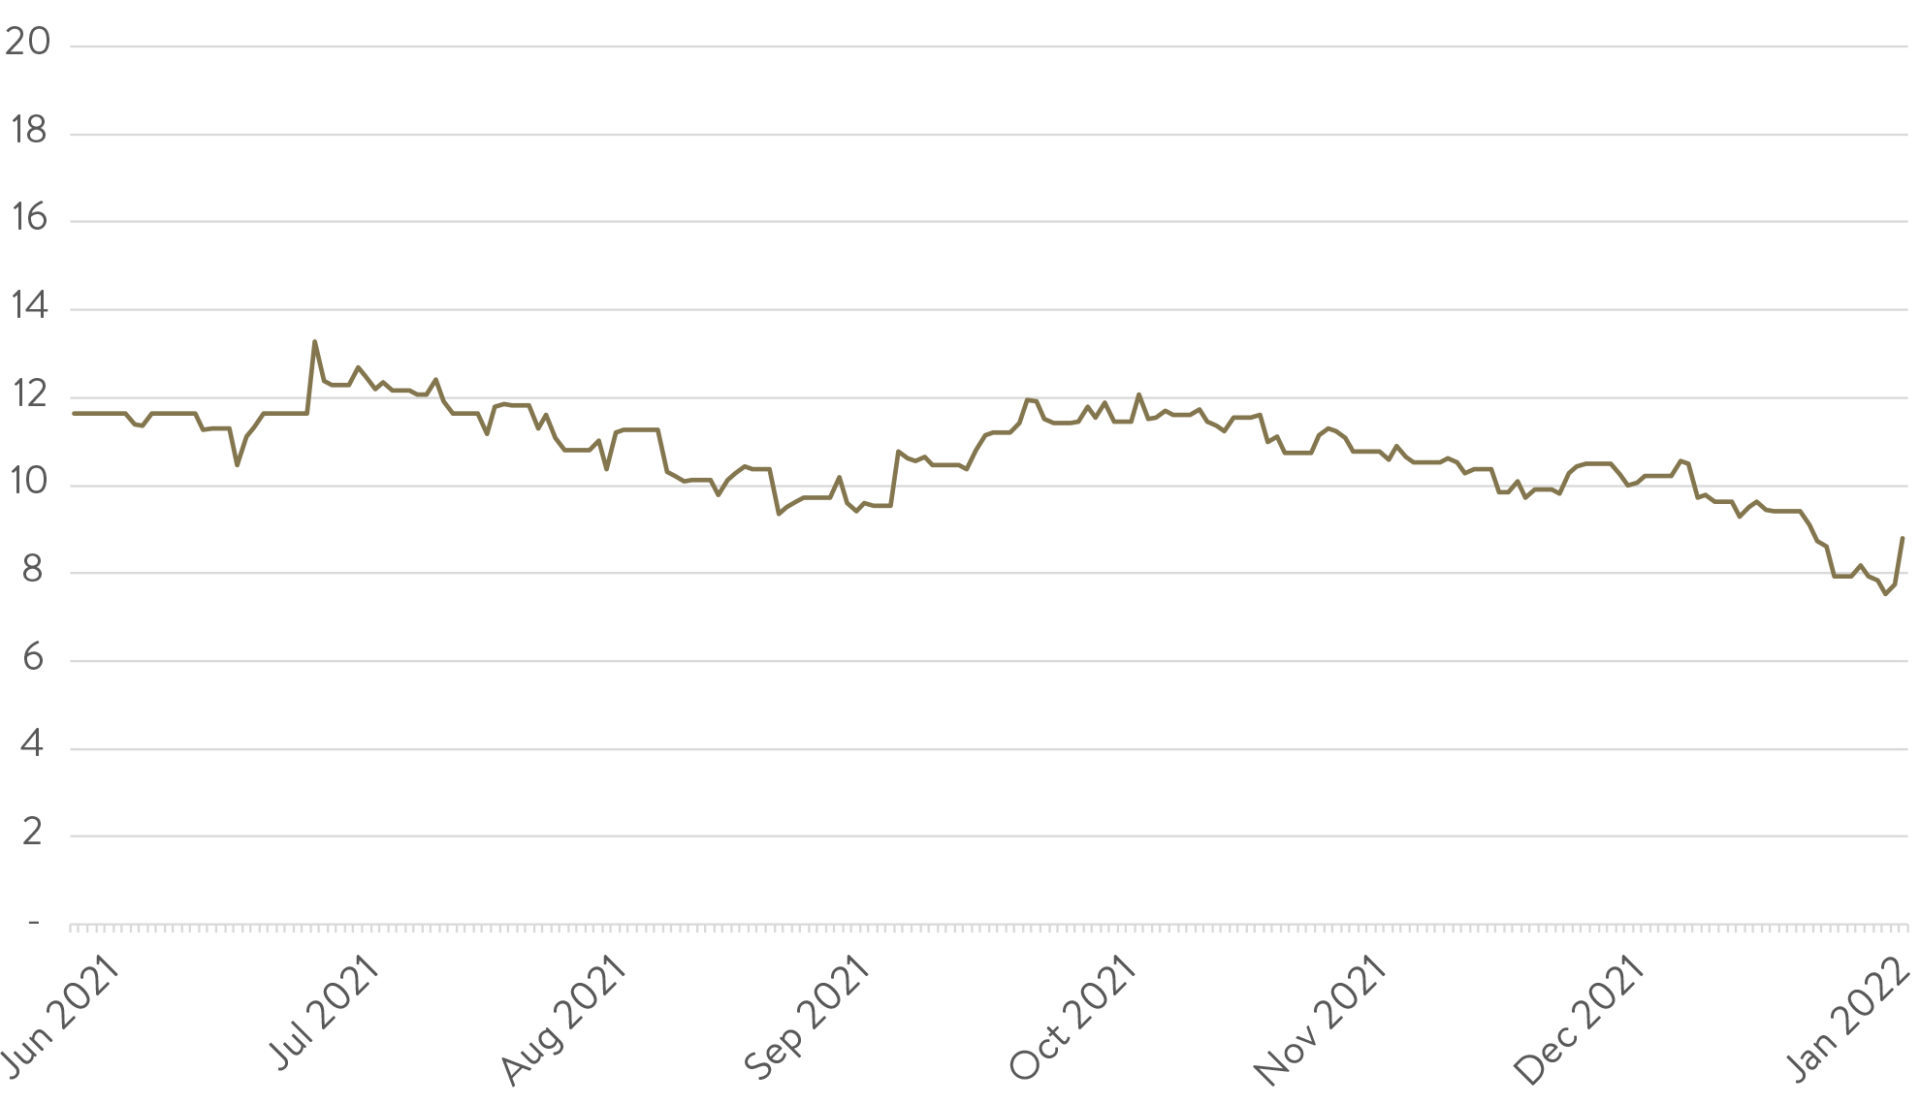
Source: Ophir, Factset Finally in terms of value, by way of example, below we show our preferred valuation metric for our Global Opportunities Fund: Enterprise Value of a company (Equity + Debt value) divided by its cash-flow-generative ability, as proxied by Earning Before Interest, Tax, Depreciation and Amortisation (EBITDA). As you can see, the price paid for EBITDA across the companies in the Global Opportunities Fund (demonstrated by their median) has decreased significantly over the last few months. All the while the fund's sustainable earnings growth capacity has remained consistent in the 20-30% range. GOF EV/EBITDA (12m forward)
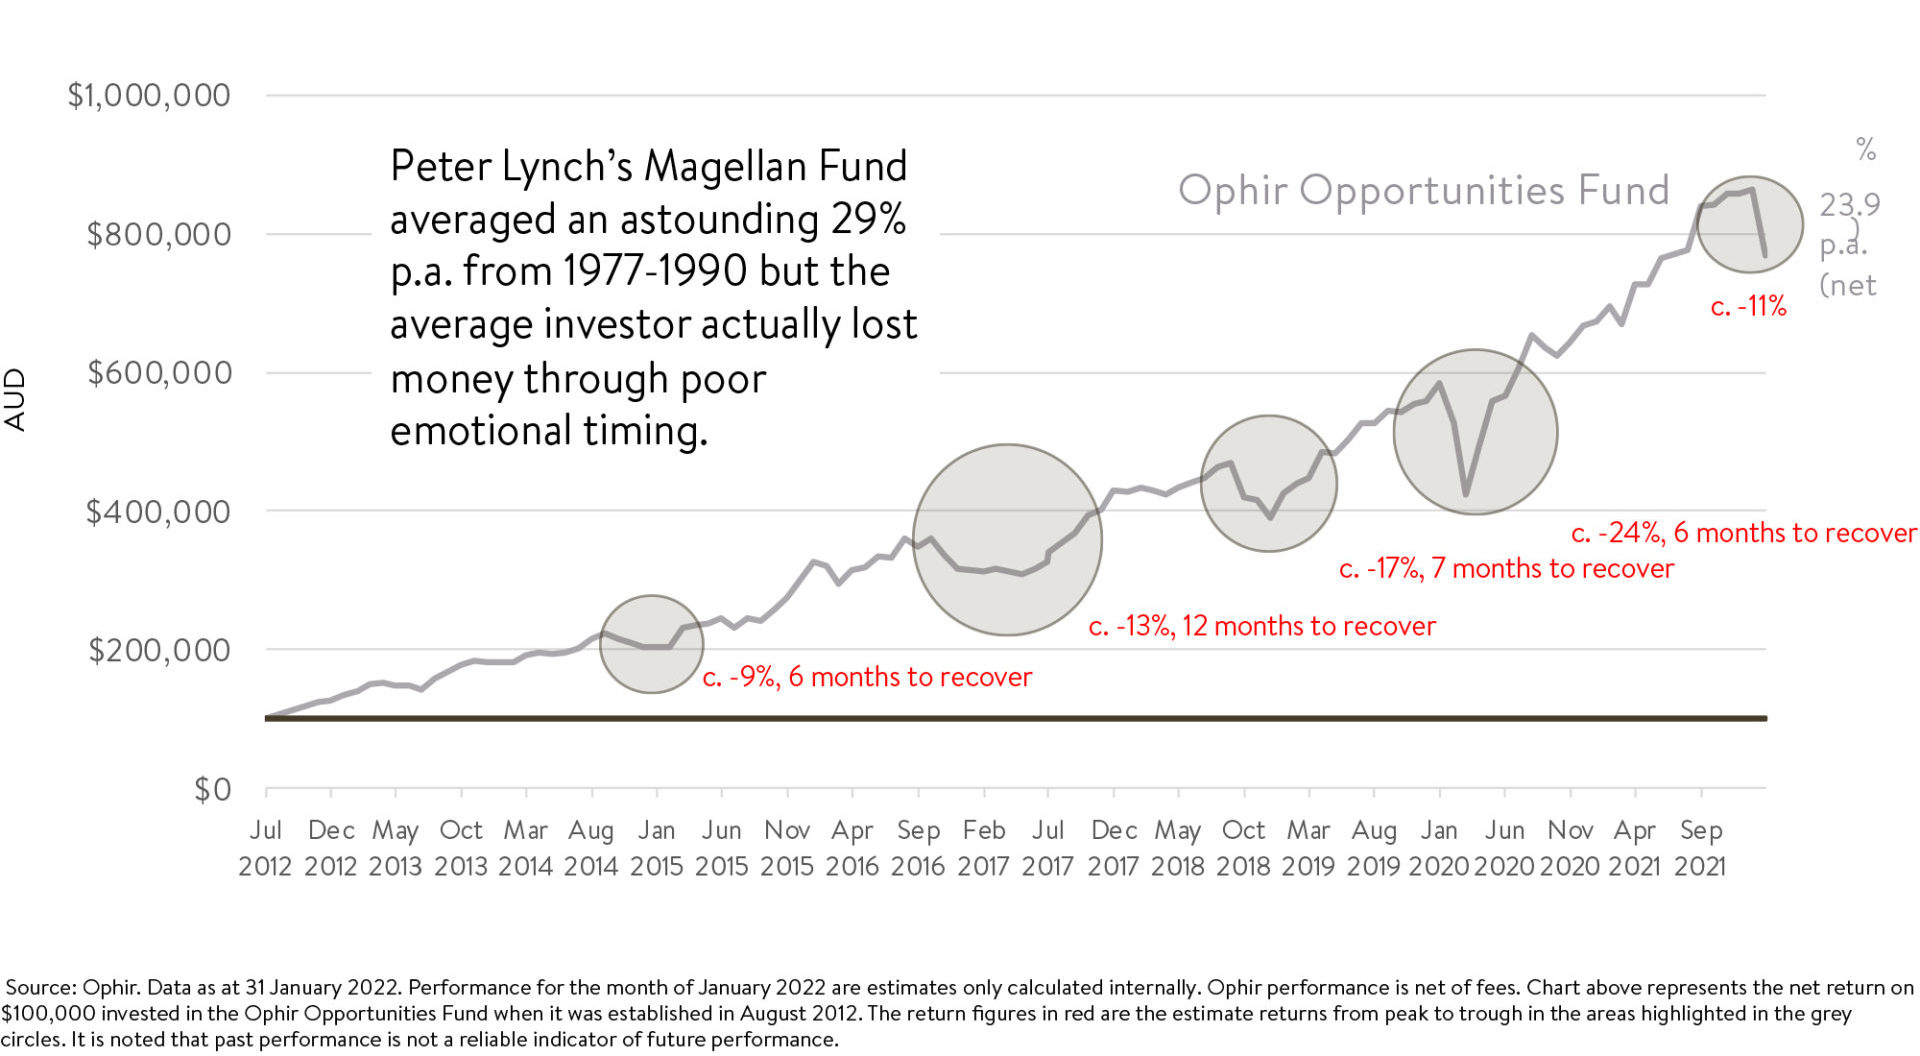
Source: Ophir, Factset The bottom line here is that, in all its history, we have not seen the earnings growth in this fund as cheap to buy as today. Could it get cheaper? Yes absolutely. But on a medium-term to long term basis we see great value on offer so remain being close to fully invested (only 1-2% cash) in this fund. And finally, we've heard this record before No one likes to go through periods of negative performance or underperformance compared to the market - least of all us! We have and will continue to have all our investable wealth in the Ophir Funds. But we also know that this time is not unique. We have had pullbacks in performance before. Below we show the almost 10-year performance history of our Ophir Opportunities Fund - our original Australian small-cap fund that has generated an asset-class-leading 23.9%pa (net). There have been five periods of material pullbacks now, one about every two years, so they've hardly been infrequent. Late 2016 probably is the closest analogy to now. You may remember this was the time when Trump was elected with a reflationary agenda and we saw synchronised global growth and higher interest rates. The commonality of these five periods shown below is they saw circa 10-25% falls in performance and 6-12 months to recover to their previous peaks.
For those that have seen enough cycles as we have, these periods have generally been opportune times to add to investments at reduced prices. A cautionary tale is in the anecdote above from famed investor Peter Lynch's Magellan Fund. Magellan was the best returning share fund from 1977 to 1990. But the average investor in the fund actually lost money! How? They tended to put money into the fund after short-term outperformance and took money out when it had performed poorly - the total opposite of the proven strategy of buying low and selling high. In fact, you could say that transitory negative performance and underperformance to peers in the short term is a feature, not a bug, of generating superior long-term performance. Written By Andrew Mitchell & Steven Ng, Co-Founders & Senior Portfolio Managers |
|
Funds operated by this manager: |
|
This document is issued by Ophir Asset Management Pty Ltd (ABN 88 156 146 717, AFSL 420 082) (Ophir) in relation to the Ophir Opportunities Fund, the Ophir High Conviction Fund and the Ophir Global Opportunities Fund (the Funds). Ophir is the trustee and investment manager for the Ophir Opportunities Fund. The Trust Company (RE Services) Limited ABN 45 003 278 831 AFSL 235150 (Perpetual) is the responsible entity of, and Ophir is the investment manager for, the Ophir Global Opportunities Fund and the Ophir High Conviction Fund. Ophir is authorised to provide financial services to wholesale clients only (as defined under s761G or s761GA of the Corporations Act 2001 (Cth)). This information is intended only for wholesale clients and must not be forwarded or otherwise made available to anyone who is not a wholesale client. Only investors who are wholesale clients may invest in the Ophir Opportunities Fund. The information provided in this document is general information only and does not constitute investment or other advice. The information is not intended to provide financial product advice to any person. No aspect of this information takes into account the objectives, financial situation or needs of any person. Before making an investment decision, you should read the offer document and (if appropriate) seek professional advice to determine whether the investment is suitable for you. The content of this document does not constitute an offer or solicitation to subscribe for units in the Funds. Ophir makes no representations or warranties, express or implied, as to the accuracy or completeness of the information it provides, or that it should be relied upon and to the maximum extent permitted by law, neither Ophir nor its directors, employees or agents accept any liability for any inaccurate, incomplete or omitted information of any kind or any losses caused by using this information. This information is current as at the date specified and is subject to change. An investment may achieve a lower than expected return and investors risk losing some or all of their principal investment. Ophir does not guarantee repayment of capital or any particular rate of return from the Funds. Past performance is no indication of future performance. Any investment decision in connection with the Funds should only be made based on the information contained in the relevant Information Memorandum or Product Disclosure Statement. |