AFM Fund Profile — Nikko AM New Asia Fund


- Fund & Manager Details
- Investment Details
- Performance & Risk
- Advanced Analytics
- Research & Availability
- News & Insights
- Documents
Fund & Manager Details
Key Facts
| Fund Type: | Single | Discretionary/Quantitative: | Discretionary |
| Strategy: | Equity Long | This Funds FUM (millions): | AU$4.05m |
| Style: | Growth | Fund Inception Date: | Since 01 November 2005 |
| Geographic Mandate: | Asia ex Japan | Latest Return Date: | January 2023 |
| Fund Domicile: | Australia | Investor Type: | Retail |
| Status: | Closed | Reporting Status: | Ceased Reporting |
Manager Details and Fund Description
| Manager: | Nikko Asset Management Australia | Total FUM for all funds: | US$10,995m |
|
Manager Overview:
Nikko AM Australia offers investors the benefits of extensive global resources combined with the local expertise and long-standing experience of our Sydney based investment teams, with a history dating back to 1987. The company manages assets for retail and institutional clients across Australia.
Nikko AM Australia is owned by Tokyo-based Nikko Asset Management Co., Ltd., one of Asia's largest asset managers, providing high-conviction, active fund management across a range of Equity, Fixed Income and Multi-Asset strategies. Established in 1959, Nikko Asset Management has offices across 11 countries and enjoys one of the largest distributor networks in the Asian region, serving both retail and institutional clients. The firm's extensive footprint across the Asia-Pacific region includes local offices in Tokyo, Singapore, Hong Kong, Sydney, Melbourne and Auckland, and provides an extraordinary depth of expertise in the local issues that drive investment performance globally. In addition, they gain valuable insights from affiliates in China, India and Malaysia. Offices in New York and London provide support to investors in the US, Europe and the Middle East, as well as expertise in global markets. Nikko Asset Management Australia offers investors the benefits of a large organisational infrastructure with extensive global resources, combined with the local expertise and experience of Australian investment managers based in Sydney. |
Fund/Strategy Overview:
The Nikko AM New Asia Fund invests in securities in Asia (excluding Japan) and cash. As a guideline, the Fund will usually hold approximately 40 - 60 different securities. The Nikko AM Asia equity team believe active management of an Asian equity portfolio is the best way to achieve long-term capital growth. Asian markets are inefficient and individual stocks can go through periods of mis- pricing. The team will select securities for the Fund predominantly by using a bottom-up stock selection approach, and will generally take a long-term view to investing.
|
||
| Other funds operated by manager: | |||
| Nikko AM ARK Global Disruptive Innovation Fund, Nikko AM Global Share Fund | |||
Investment Details
Investment Terms
| Minimum Investment: | Minimum Additional Investment: | Minimum Term: | Investment Frequency: |
| AU$10,000 | AU$1,000 | Daily | |
| Regular Savings Option: | Regular Savings Min. Amount: |
Regular Savings Max. Amount: |
Regular Savings Freq.: |
| Yes | AU$250 | Monthly | |
| Redemption Notice: | Redemption Frequency: | Notes: | |
| 1 Days | Daily |
||
| Distributions: | Distribution Frequency: | Last Distribution Date: | Last Distribution Amount: |
| Yes | Annually | AU$ |
Structure
| Offshore/Onshore: | Fund Structure: | Share Classes: |
Trustee/Responsible Entity: |
| Onshore | Unit Trust | AU$ | Nikko Asset Management Australia Limited |
| Administrator: | Prime Broker: | Custodian: | Legal: |
| BNP Paribas Securities Services | N/A | BNP Paribas Securities Services | N/A |
Fund Fees
| Management Fee: |
Performance Fee: |
High Water Mark: |
Hurdle: |
| 1.025% | 10.25% | Yes | N/A |
| Buy Spread: | Sell spread: | Early Redemption Fee: | Fees Notes: |
| 0.250% | 0.250% | No |
Performance & Risk
Returns
| Latest Return Date: | Latest Result: | Fund Inception Date: | Annualised Return: |
| January 2023 | 3.07% | 01 November 2005 | 6.34% |
| Latest 3 Months: | Latest 6 Months: | Latest 12 Months: | Latest 2 Years p.a.: |
| 11.55% | -1.58% | -15.61% | -9.55% |
| Latest 3 Years p.a.: |
Latest 4 Years p.a.: |
Latest 5 Years p.a.: |
Latest 7 Years p.a.: |
| 1.83% | 7.04% | 3.59% | 7.62% |
Performance Statistics
| % Positive Months (S.I.): |
Average Return: | Average +ve Return: | Average -ve Return: |
| 58.45% | 0.60% | 3.21% | -3.07% |
| Best Month: | Worst Month: | Up Capture Ratio (S.I.): |
Down Capture Ratio (S.I.): |
| 11.40% | -13.89% | 115.02% | 98.33% |
| Largest Drawdown (S.I.): |
Longest Drawdown (S.I.): |
Current Drawdown (%): |
Current Drawdown (Months): |
| -47.59% | 85 months | -19.94% | 19 months |
Risk
| Annualised Standard Deviation (S.I.): |
Downside Deviation (S.I.): |
Sortino Ratio (S.I.): |
- |
| 14.24% | 10.06% | 0.32 | - |
| Sharpe Ratio (12 months): |
Sharpe Ratio (3 years): |
Sharpe Ratio (5 years): |
Sharpe Ratio (S.I.): |
| -1.16 | 0.16 | 0.27 | 0.30 |
| Please note, Sharpe and Sortino ratios are calculated using the Australian Risk Free Rate | |||
Ranking, Research & Availability
Fund Quintile in its Peer Group (Equity Long - Asia)
AFM's Quintile Rankings show performance and Key Performance Indicators (KPI's) of Nikko AM New Asia Fund compared to a peer group of funds with a similar strategy and geographic mandate. Each green square places a fund in one quintile (or 20%) of its peer group - five indicating that the fund is in the top (best) quintile for the corresponding KPI.
As a reference point the equivalent "quintile" performance of the peer group's underlying market index is also indicated by the red dot.
Quintile data is pending for Nikko AM New Asia Fund.
External Research and Ratings: As reported by each Fund Manager.
| Lonsec: | Recommended, February 2020 |
Availability:As reported by each Fund Manager.
News & Insights
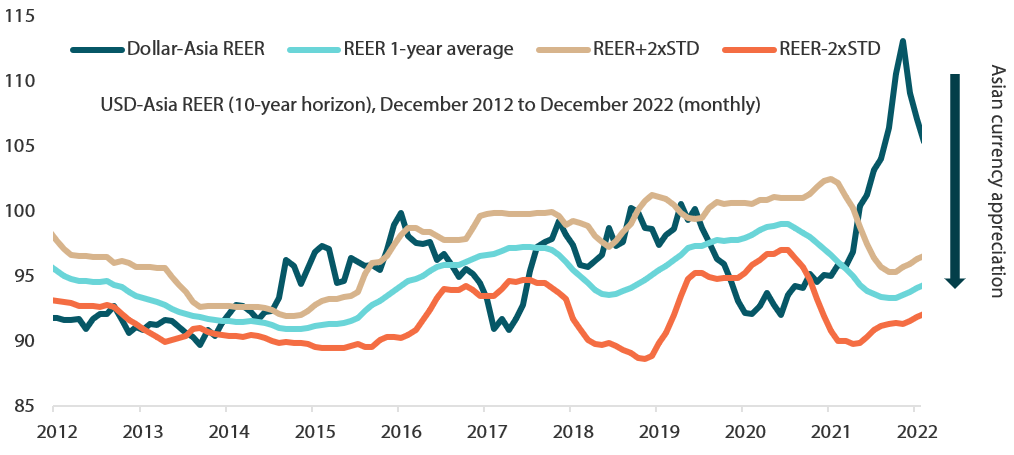
Another key stress factor global markets had to withstand since early 2022 was the aggressive monetary tightening by the US Federal Reserve (Fed) and other major central banks, many of which have implemented a series of interest rate hikes to quell decades-high inflation.


In his 1976 novelette "The Bicentennial Man", the late science fiction writer and visionary Isaac Asimov kicked off the opening plot with the main character Andrew Martin (a humanoid who wants to live and die like a human) requesting a robot surgeon to perform an intricate operation on him so that he will not live beyond the age of 200.
"The fingers were long and were shaped into artistically metallic, looping curves so graceful and appropriate that one could imagine a scalpel fitting them and becoming, temporarily, one piece with them. There would be no hesitation in his work, no stumbling, no quivering, no mistakes", wrote Asimov as he described the robot surgeon who altered Martin's positronic brain.
Asimov's foretelling vision of surgeries performed autonomously by robots could in fact become a reality in the near future
 Source: Frost & Sullivan
 Source: Frost & Sullivan, as at end 2020
 Source: FDA, MHRA, NMPA, EMA, companies' data and UBS, as at November 2022

")


Fund Performance
Historical Performance (all figures shown here are net of fees unless otherwise stated)
| Year | Jan % | Feb % | Mar % | Apr % | May % | Jun % | Jul % | Aug % | Sep % | Oct % | Nov % | Dec % | YTD % |
|---|---|---|---|---|---|---|---|---|---|---|---|---|---|
| 2023 | 3.07 | N/R | N/R | N/R | N/R | N/R | N/R | N/R | N/R | N/R | N/R | N/R | 3.07 |
| 2022 | -2.39 | -4.93 | -7.14 | 0.61 | -0.65 | -0.17 | -2.67 | -1.08 | -6.22 | -4.89 | 9.45 | -1.12 | -20.09 |
| 2021 | 4.35 | -0.93 | -1.83 | 1.92 | 1.67 | 1.40 | -1.10 | 0.27 | -1.64 | -2.26 | 3.22 | -1.23 | 3.65 |
| 2020 | 3.83 | 0.13 | -6.73 | 2.88 | -0.95 | 7.51 | 6.33 | 0.68 | 0.11 | 5.20 | 3.09 | 4.00 | 28.41 |
| 2019 | 3.33 | 6.76 | 2.19 | 0.80 | -6.50 | 5.69 | -0.08 | 0.51 | 1.35 | 3.14 | 1.67 | 3.24 | 23.72 |
| 2018 | 3.09 | -1.43 | -1.10 | 1.36 | -0.06 | -4.19 | -1.57 | 1.11 | -0.36 | -9.11 | 2.29 | 0.82 | -9.34 |
| 2017 | 0.60 | 0.88 | 5.68 | 3.11 | 3.94 | -1.14 | 0.02 | 1.44 | 2.55 | 7.76 | 3.54 | -0.78 | 30.89 |
| 2016 | -6.22 | -3.06 | 0.84 | 1.05 | 4.18 | -0.26 | 2.14 | 5.18 | -1.60 | -1.59 | -1.88 | -0.84 | -2.55 |
| 2015 | 8.76 | 0.24 | 3.55 | 3.57 | 2.43 | -4.25 | -1.30 | -6.99 | -0.36 | 4.19 | -5.99 | -1.29 | 1.42 |
| 2014 | -1.60 | 0.26 | -1.50 | -0.79 | 3.82 | 1.30 | 5.38 | 1.15 | 2.62 | 1.34 | 3.84 | 2.77 | 19.96 |
| 2013 | 3.37 | 1.78 | -3.68 | 2.92 | 7.20 | -1.45 | 2.08 | -0.70 | -0.49 | 3.48 | 4.91 | 1.46 | 22.42 |
| 2012 | 6.44 | 3.59 | 1.35 | 0.80 | -3.12 | -2.51 | -1.37 | 1.45 | 6.47 | -1.55 | 3.34 | 4.38 | 20.37 |
| 2011 | 1.07 | -5.92 | 2.49 | -2.70 | 1.12 | -1.48 | -0.94 | -6.92 | -7.48 | 2.92 | -5.81 | 0.96 | -21.12 |
| 2010 | -5.46 | -0.56 | 4.53 | 1.08 | 1.66 | -1.12 | -0.64 | 2.70 | 2.26 | -1.06 | -1.26 | -2.49 | -0.73 |
| 2009 | 2.82 | -10.10 | 5.69 | 11.30 | 11.40 | -2.89 | 8.72 | -6.02 | 2.94 | -1.43 | -0.09 | 6.08 | 29.26 |
| 2008 | -12.64 | -0.95 | -3.97 | 0.78 | -4.75 | -13.89 | 0.61 | -0.23 | -9.04 | -10.42 | -3.81 | 6.19 | -42.62 |
| 2007 | 1.83 | 0.73 | 0.79 | 0.80 | 8.39 | 1.39 | 3.94 | 0.28 | 3.09 | 7.55 | -3.91 | 2.82 | 30.76 |
| 2006 | 4.02 | 1.06 | 7.10 | 2.18 | -4.86 | -1.03 | -1.78 | 2.60 | 8.19 | -0.06 | 7.27 | 2.27 | 29.47 |
| 2005 | N/R | N/R | N/R | N/R | N/R | N/R | N/R | N/R | N/R | N/R | 0.88 | 3.43 | 4.34 |
Historical Financial Year Performance (all figures shown here are are percentage per month net of fees unless otherwise stated)
| Year | Jul % | Aug % | Sep % | Oct % | Nov % | Dec % | Jan % | Feb % | Mar % | Apr % | May % | Jun % | FYTD % |
|---|---|---|---|---|---|---|---|---|---|---|---|---|---|
| 2022/2023 | -2.67 | -1.08 | -6.22 | -4.89 | 9.45 | -1.12 | 3.07 | N/A | N/A | N/A | N/A | N/A | -4.21 |
| 2021/2022 | -1.10 | 0.27 | -1.64 | -2.26 | 3.22 | -1.23 | -2.39 | -4.93 | -7.14 | 0.61 | -0.65 | -0.17 | -16.42 |
| 2020/2021 | 6.33 | 0.68 | 0.11 | 5.20 | 3.09 | 4.00 | 4.35 | -0.93 | -1.83 | 1.92 | 1.67 | 1.40 | 28.90 |
| 2019/2020 | -0.08 | 0.51 | 1.35 | 3.14 | 1.67 | 3.24 | 3.83 | 0.13 | -6.73 | 2.88 | -0.95 | 7.51 | 17.07 |
| 2018/2019 | -1.57 | 1.11 | -0.36 | -9.11 | 2.29 | 0.82 | 3.33 | 6.76 | 2.19 | 0.80 | -6.50 | 5.69 | 4.36 |
| 2017/2018 | 0.02 | 1.44 | 2.55 | 7.76 | 3.54 | -0.78 | 3.09 | -1.43 | -1.10 | 1.36 | -0.06 | -4.19 | 12.35 |
| 2016/2017 | 2.14 | 5.18 | -1.60 | -1.59 | -1.88 | -0.84 | 0.60 | 0.88 | 5.68 | 3.11 | 3.94 | -1.14 | 15.02 |
| 2015/2016 | -1.30 | -6.99 | -0.36 | 4.19 | -5.99 | -1.29 | -6.22 | -3.06 | 0.84 | 1.05 | 4.18 | -0.26 | -14.86 |
| 2014/2015 | 5.38 | 1.15 | 2.62 | 1.34 | 3.84 | 2.77 | 8.76 | 0.24 | 3.55 | 3.57 | 2.43 | -4.25 | 35.66 |
| 2013/2014 | 2.08 | -0.70 | -0.49 | 3.48 | 4.91 | 1.46 | -1.60 | 0.26 | -1.50 | -0.79 | 3.82 | 1.30 | 12.65 |
| 2012/2013 | -1.37 | 1.45 | 6.47 | -1.55 | 3.34 | 4.38 | 3.37 | 1.78 | -3.68 | 2.92 | 7.20 | -1.45 | 24.68 |
| 2011/2012 | -0.94 | -6.92 | -7.48 | 2.92 | -5.81 | 0.96 | 6.44 | 3.59 | 1.35 | 0.80 | -3.12 | -2.51 | -11.17 |
| 2010/2011 | -0.64 | 2.70 | 2.26 | -1.06 | -1.26 | -2.49 | 1.07 | -5.92 | 2.49 | -2.70 | 1.12 | -1.48 | -6.08 |
| 2009/2010 | 8.72 | -6.02 | 2.94 | -1.43 | -0.09 | 6.08 | -5.46 | -0.56 | 4.53 | 1.08 | 1.66 | -1.12 | 9.72 |
| 2008/2009 | 0.61 | -0.23 | -9.04 | -10.42 | -3.81 | 6.19 | 2.82 | -10.10 | 5.69 | 11.30 | 11.40 | -2.89 | -1.71 |
| 2007/2008 | 3.94 | 0.28 | 3.09 | 7.55 | -3.91 | 2.82 | -12.64 | -0.95 | -3.97 | 0.78 | -4.75 | -13.89 | -21.58 |
| 2006/2007 | -1.78 | 2.60 | 8.19 | -0.06 | 7.27 | 2.27 | 1.83 | 0.73 | 0.79 | 0.80 | 8.39 | 1.39 | 36.89 |
| 2005/2006 | N/A | N/A | N/A | N/A | 0.88 | 3.43 | 4.02 | 1.06 | 7.10 | 2.18 | -4.86 | -1.03 | 13.02 |