AFM Fund Profile — Alphinity Global Sustainable Equity Fund


- Fund & Manager Details
- Investment Details
- Performance & Risk
- Advanced Analytics
- Research & Availability
- News & Insights
- Documents
Fund & Manager Details
Key Facts
| Fund Type: | Single | Discretionary/Quantitative: | Discretionary |
| Strategy: | Equity Long | This Funds FUM (millions): | AU$76.3m |
| Style: | Value | Fund Inception Date: | Since 02 June 2021 |
| Geographic Mandate: | Global | Latest Return Date: | May 2026 |
| Fund Domicile: | Australia | Investor Type: | Retail |
| Status: | Open | Reporting Status: | Current |
Manager Details and Fund Description
| Manager: | Alphinity Investment Management | Total FUM for all funds: | AU$15,000m |
|
Manager Overview:
Alphinity is an active, boutique, equities investment manager based in Sydney and majority owned by its staff. Alphinity has dedicated experienced teams managing both Australian and global equity funds. The company was established in 2010 with its founding partners having managed Australian investment funds together on the same basis since the early 2000s.
In 2015, Alphinity expanded to include a highly experienced and dedicated global investment team applying the same philosophy and process to the large set of investment opportunities outside of Australia. They identify these companies using a combination of fundamental analysis and specific quantitative inputs. |
Fund/Strategy Overview:
The Fund seeks to build a portfolio of high-quality companies, which can have a net positive alignment with one or more of the 17 United Nations'Sustainable Development Goals (SDGs), exceed Alphinity's minimum ESG criteria, and are also identified as undervalued and within an earnings upgrade cycle. Alphinity aims to meet the Fund's investment objectives in a risk-controlled manner with a portfolio that is diversified across different sectors and regions. It searches for businesses with expected positive earnings and price momentum, that are backed by real cash flows, and return on capital and are trading at an attractive valuation. Typically the portfolio will hold 25-40 stocks. |
||
| Other funds operated by manager: | |||
| Alphinity Australian Share Fund, Alphinity Concentrated Australian Share Fund, Alphinity Global Equity Fund, Alphinity Sustainable Share Fund | |||
Investment Details
Investment Terms
| Minimum Investment: | Minimum Additional Investment: | Minimum Term: | Investment Frequency: |
| AU$10,000 | 0 | Daily | |
| Regular Savings Option: | Regular Savings Min. Amount: |
Regular Savings Max. Amount: |
Regular Savings Freq.: |
| Yes | Monthly | ||
| Redemption Notice: | Redemption Frequency: | Notes: | |
| 1 Days | Daily |
||
| Distributions: | Distribution Frequency: | Last Distribution Date: | Last Distribution Amount: |
| Yes | Annually | AU$ |
Structure
| Offshore/Onshore: | Fund Structure: | Share Classes: |
Trustee/Responsible Entity: |
| Onshore | Unit Trust | AU$ | Fidante Partners |
| Administrator: | Prime Broker: | Custodian: | Legal: |
Fund Fees
| Management Fee: |
Performance Fee: |
High Water Mark: |
Hurdle: |
| 0.75% | 10% | Yes | RBA Cash Rate |
| Buy Spread: | Sell spread: | Early Redemption Fee: | Fees Notes: |
| 0.250% | 0.250% | No |
Performance & Risk
Returns
| Latest Return Date: | Latest Result: | Fund Inception Date: | Annualised Return: |
| May 2026 | 1.13% | 02 June 2021 | 6.50% |
| Latest 3 Months: | Latest 6 Months: | Latest 12 Months: | Latest 2 Years p.a.: |
| 2.80% | -6.05% | 0.10% | 1.70% |
| Latest 3 Years p.a.: |
Latest 4 Years p.a.: |
Latest 5 Years p.a.: |
Latest 7 Years p.a.: |
| 8.13% | 8.96% | N/A | N/A |
Performance Statistics
| % Positive Months (S.I.): |
Average Return: | Average +ve Return: | Average -ve Return: |
| 62.71% | 0.60% | 2.95% | -3.37% |
| Best Month: | Worst Month: | Up Capture Ratio (S.I.): |
Down Capture Ratio (S.I.): |
| 8.00% | -7.32% | 86.81% | 117.83% |
| Largest Drawdown (S.I.): |
Longest Drawdown (S.I.): |
Current Drawdown (%): |
Current Drawdown (Months): |
| -20.63% | 24 months | -6.99% | 16 months |
Risk
| Annualised Standard Deviation (S.I.): |
Downside Deviation (S.I.): |
Sortino Ratio (S.I.): |
- |
| 12.94% | 8.58% | 0.38 | - |
| Sharpe Ratio (12 months): |
Sharpe Ratio (3 years): |
Sharpe Ratio (5 years): |
Sharpe Ratio (S.I.): |
| -0.36 | 0.39 | N/A | 0.32 |
| Please note, Sharpe and Sortino ratios are calculated using the Australian Risk Free Rate | |||
Ranking, Research & Availability
Fund Quintile in its Peer Group (Equity Long - Large Cap - Global) as at April 2026
AFM's Quintile Rankings show performance and Key Performance Indicators (KPI's) of Alphinity Global Sustainable Equity Fund compared to a peer group of funds with a similar strategy and geographic mandate. Each green square places a fund in one quintile (or 20%) of its peer group - five indicating that the fund is in the top (best) quintile for the corresponding KPI.
As a reference point the equivalent "quintile" performance of the peer group's underlying market index is also indicated by the red dot.
External Research and Ratings: As reported by each Fund Manager.
| Morningstar Star Rating: | 2 stars, February 2026 |
| Lonsec: | Recommended, March 2025 |
| Zenith: | Recommended, November 2025 |
Availability:As reported by each Fund Manager.
No investment platforms suppliedNews & Insights

Markets don't wait for certainty. They reprice the expectation. (4-minute read)
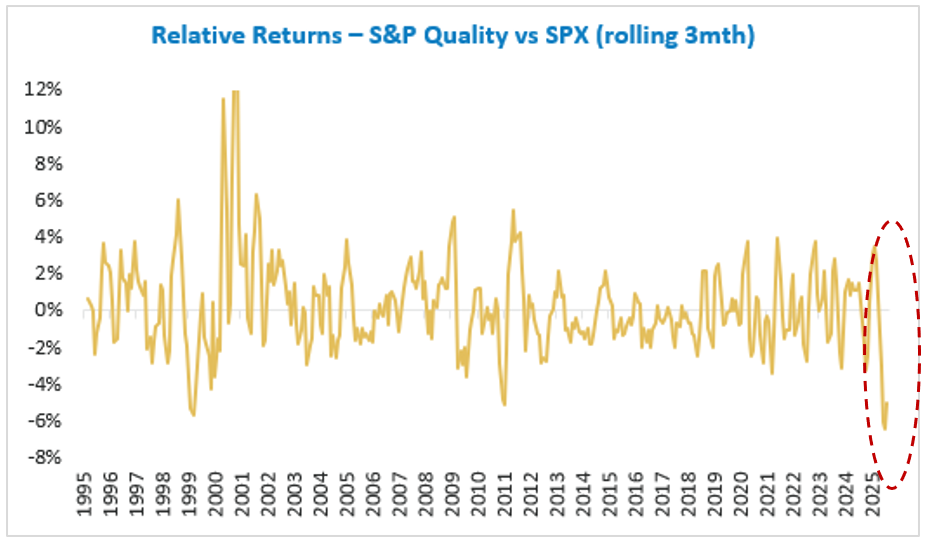
drivers of both risk and opportunity across our portfolio holdings.
Fund Performance
Historical Performance (all figures shown here are net of fees unless otherwise stated)
| Year | Jan % | Feb % | Mar % | Apr % | May % | Jun % | Jul % | Aug % | Sep % | Oct % | Nov % | Dec % | YTD % |
|---|---|---|---|---|---|---|---|---|---|---|---|---|---|
| 2026 | -4.89 | -2.88 | -3.12 | 4.93 | 1.13 | N/R | N/R | N/R | N/R | N/R | N/R | N/R | -5.04 |
| 2025 | 0.71 | -2.47 | -6.33 | -2.93 | 4.77 | 1.51 | 3.06 | -0.37 | 0.27 | 1.78 | 0.18 | -1.07 | -1.36 |
| 2024 | 6.60 | 8.00 | 3.23 | -3.81 | 2.93 | 2.69 | 0.96 | 0.10 | -2.08 | 2.37 | 5.40 | 0.72 | 29.94 |
| 2023 | 2.40 | 1.15 | 3.59 | 0.08 | 2.66 | 1.30 | 1.47 | 1.01 | -4.92 | -1.54 | 6.13 | 0.69 | 14.50 |
| 2022 | -5.57 | -7.32 | -0.08 | -3.48 | -3.02 | -3.04 | 7.13 | -2.57 | -1.60 | 6.75 | 1.72 | -6.48 | -17.22 |
| 2021 | N/R | N/R | N/R | N/R | N/R | N/R | 6.39 | 5.42 | -4.58 | 3.61 | 4.98 | 1.49 | 18.14 |
Historical Financial Year Performance (all figures shown here are are percentage per month net of fees unless otherwise stated)
| Year | Jul % | Aug % | Sep % | Oct % | Nov % | Dec % | Jan % | Feb % | Mar % | Apr % | May % | Jun % | FYTD % |
|---|---|---|---|---|---|---|---|---|---|---|---|---|---|
| 2025/2026 | 3.06 | -0.37 | 0.27 | 1.78 | 0.18 | -1.07 | -4.89 | -2.88 | -3.12 | 4.93 | 1.13 | N/A | -1.38 |
| 2024/2025 | 0.96 | 0.10 | -2.08 | 2.37 | 5.40 | 0.72 | 0.71 | -2.47 | -6.33 | -2.93 | 4.77 | 1.51 | 2.14 |
| 2023/2024 | 1.47 | 1.01 | -4.92 | -1.54 | 6.13 | 0.69 | 6.60 | 8.00 | 3.23 | -3.81 | 2.93 | 2.69 | 23.90 |
| 2022/2023 | 7.13 | -2.57 | -1.60 | 6.75 | 1.72 | -6.48 | 2.40 | 1.15 | 3.59 | 0.08 | 2.66 | 1.30 | 16.47 |
| 2021/2022 | 6.39 | 5.42 | -4.58 | 3.61 | 4.98 | 1.49 | -5.57 | -7.32 | -0.08 | -3.48 | -3.02 | -3.04 | -6.23 |