AFM Fund Profile — Alphinity Concentrated Australian Share Fund


- Fund & Manager Details
- Investment Details
- Performance & Risk
- Advanced Analytics
- Research & Availability
- News & Insights
- Documents
Fund & Manager Details
Key Facts
| Fund Type: | Single | Discretionary/Quantitative: | Discretionary |
| Strategy: | Equity Long | This Funds FUM (millions): | AU$138.87m |
| Style: | Blend | Fund Inception Date: | Since 01 September 2010 |
| Geographic Mandate: | Australia | Latest Return Date: | May 2026 |
| Fund Domicile: | Australia | Investor Type: | Retail |
| Status: | Open | Reporting Status: | Current |
Manager Details and Fund Description
| Manager: | Alphinity Investment Management | Total FUM for all funds: | AU$15,000m |
|
Manager Overview:
Alphinity is an active, boutique, equities investment manager based in Sydney and majority owned by its staff. Alphinity has dedicated experienced teams managing both Australian and global equity funds. The company was established in 2010 with its founding partners having managed Australian investment funds together on the same basis since the early 2000s.
In 2015, Alphinity expanded to include a highly experienced and dedicated global investment team applying the same philosophy and process to the large set of investment opportunities outside of Australia. They identify these companies using a combination of fundamental analysis and specific quantitative inputs. |
Fund/Strategy Overview:
Alphinity's investment approach is based on a combination of strong fundamental bottom-up research and targeted quantitative inputs aimed specifically at identifying mispriced companies likely to deliver earnings in excess of those expected by the market. The combined output of this fundamental and quantitative research is brought together in Alphinity's proprietary Composite Research Model (CRM).
The investment universe is comprised of Australian stocks listed on the ASX. The final portfolio will be made up of between 20 and 35 stocks depending on their CRM score and the fundamental analysis by the investment team. Portfolio construction guidelines limit the Fund's exposure to any one company or sector. |
||
| Other funds operated by manager: | |||
| Alphinity Australian Share Fund, Alphinity Global Equity Fund, Alphinity Global Sustainable Equity Fund, Alphinity Sustainable Share Fund | |||
Investment Details
Investment Terms
| Minimum Investment: | Minimum Additional Investment: | Minimum Term: | Investment Frequency: |
| AU$10,000 | AU$1,000 | Daily | |
| Regular Savings Option: | Regular Savings Min. Amount: |
Regular Savings Max. Amount: |
Regular Savings Freq.: |
| Yes | AU$100 | Monthly | |
| Redemption Notice: | Redemption Frequency: | Notes: | |
| Daily |
|||
| Distributions: | Distribution Frequency: | Last Distribution Date: | Last Distribution Amount: |
| Yes | Monthly | AU$ |
Structure
| Offshore/Onshore: | Fund Structure: | Share Classes: |
Trustee/Responsible Entity: |
| Onshore | Unit Trust | AU$ | Fidante Partners |
| Administrator: | Prime Broker: | Custodian: | Legal: |
| N/A | N/A | N/A | N/A |
Fund Fees
| Management Fee: |
Performance Fee: |
High Water Mark: |
Hurdle: |
| 0.8% | 15% | No | S&P/ASX 200 Accumulation Index |
| Buy Spread: | Sell spread: | Early Redemption Fee: | Fees Notes: |
| 0.200% | 0.200% | No |
Performance & Risk
Returns
| Latest Return Date: | Latest Result: | Fund Inception Date: | Annualised Return: |
| May 2026 | 1.89% | 01 September 2010 | 7.66% |
| Latest 3 Months: | Latest 6 Months: | Latest 12 Months: | Latest 2 Years p.a.: |
| -5.71% | 4.51% | 6.42% | 11.55% |
| Latest 3 Years p.a.: |
Latest 4 Years p.a.: |
Latest 5 Years p.a.: |
Latest 7 Years p.a.: |
| 11.42% | 9.15% | 8.21% | 8.79% |
Performance Statistics
| % Positive Months (S.I.): |
Average Return: | Average +ve Return: | Average -ve Return: |
| 64.09% | 0.71% | 3.16% | -3.67% |
| Best Month: | Worst Month: | Up Capture Ratio (S.I.): |
Down Capture Ratio (S.I.): |
| 8.70% | -20.79% | 107.67% | 100.79% |
| Largest Drawdown (S.I.): |
Longest Drawdown (S.I.): |
Current Drawdown (%): |
Current Drawdown (Months): |
| -59.01% | 87 months | -5.71% | 3 months |
Risk
| Annualised Standard Deviation (S.I.): |
Downside Deviation (S.I.): |
Sortino Ratio (S.I.): |
- |
| 14.51% | 10.95% | 0.39 | - |
| Sharpe Ratio (12 months): |
Sharpe Ratio (3 years): |
Sharpe Ratio (5 years): |
Sharpe Ratio (S.I.): |
| 0.27 | 0.68 | 0.48 | 0.36 |
| Please note, Sharpe and Sortino ratios are calculated using the Australian Risk Free Rate | |||
Ranking, Research & Availability
Fund Quintile in its Peer Group (Equity Long - Large Cap - Australia) as at April 2026
AFM's Quintile Rankings show performance and Key Performance Indicators (KPI's) of Alphinity Concentrated Australian Share Fund compared to a peer group of funds with a similar strategy and geographic mandate. Each green square places a fund in one quintile (or 20%) of its peer group - five indicating that the fund is in the top (best) quintile for the corresponding KPI.
As a reference point the equivalent "quintile" performance of the peer group's underlying market index is also indicated by the red dot.
1 Year
3 Year
5 Year
7 Year
Alphinity Concentrated Australian Share Fund
ASX200 Total Return
External Research and Ratings: As reported by each Fund Manager.
| Lonsec: | Recommended, October 2025 |
| Zenith: | Highly Recommended, June 2025 |
Availability:As reported by each Fund Manager.
Available on Investment Platforms:
mFund
News & Insights
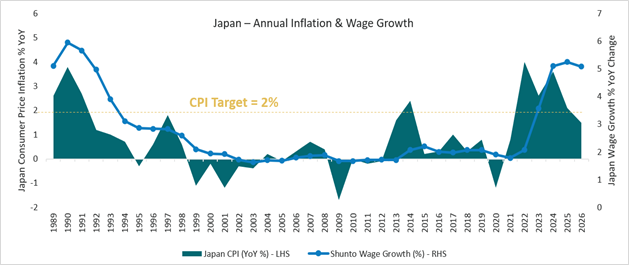
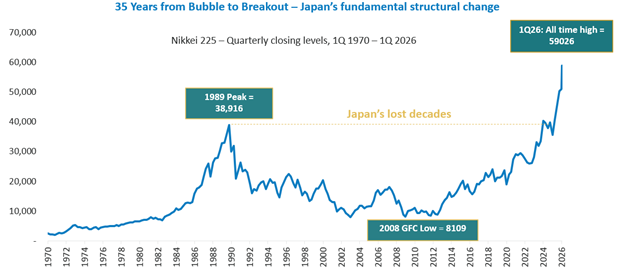
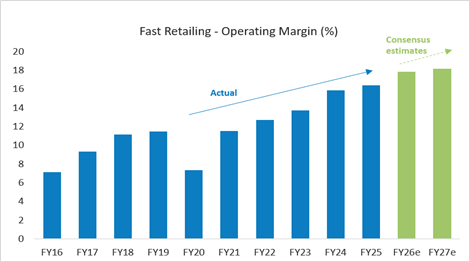
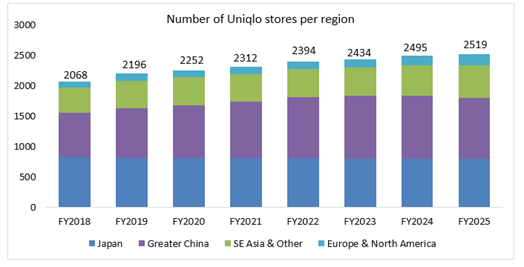
Japan - From Observation to Conviction and Two Quality Investment Ideas
Japan is changing -- and the pace of that change is easy to underestimate from a desk in Sydney. Global Portfolio Manager Chris Willcocks recently completed a week-long investor trip through Osaka, Tokyo, Kyoto and Nagoya, meeting management teams across Industrial, Consumer, Property and Technology companies. (4-minute read)
Read more...


When the Map Changes Mid-Journey
The macro has taken over. Here's how we're navigating it
Markets don't wait for certainty. They reprice the expectation. (4-minute read)
Markets don't wait for certainty. They reprice the expectation. (4-minute read)
Read more...
Global Equity Outlook 2026: Earnings, Expansion, Excellence
As we enter 2026, global equity markets are poised for the next phase of expansion. After a year defined by policy disruption, technological revolution, and geopolitical uncertainty, investors are rightly questioning whether the narrow leadership and momentum-driven returns of recent years can continue.
Read more...
Three critical social issues reshaping Australian investment risks in 2025
As we navigate an increasingly complex investment landscape, social considerations have emerged as material
drivers of both risk and opportunity across our portfolio holdings.
drivers of both risk and opportunity across our portfolio holdings.
Read more...
Fund Performance
Historical Performance (all figures shown here are net of fees unless otherwise stated)
| Year | Jan % | Feb % | Mar % | Apr % | May % | Jun % | Jul % | Aug % | Sep % | Oct % | Nov % | Dec % | YTD % |
|---|---|---|---|---|---|---|---|---|---|---|---|---|---|
| 2026 | 1.01 | 7.29 | -7.52 | 0.07 | 1.89 | N/R | N/R | N/R | N/R | N/R | N/R | N/R | 2.19 |
| 2025 | 4.45 | -4.01 | -2.38 | 3.03 | 4.30 | 1.61 | 2.37 | 3.24 | -1.79 | -0.59 | -2.88 | 2.27 | 9.53 |
| 2024 | 1.57 | 1.13 | 3.02 | -3.95 | 1.51 | 1.64 | 3.98 | 0.65 | 2.77 | -0.66 | 4.97 | -2.49 | 14.69 |
| 2023 | 6.15 | -1.34 | -0.61 | 1.58 | -2.79 | 1.50 | 1.73 | 0.46 | -2.85 | -3.51 | 4.23 | 6.31 | 10.74 |
| 2022 | -5.39 | 1.86 | 5.21 | -0.79 | -2.41 | -7.55 | 4.14 | 2.01 | -6.09 | 5.90 | 5.85 | -3.44 | -2.02 |
| 2021 | -0.12 | 2.31 | 3.09 | 3.65 | 2.42 | 1.63 | 2.05 | 1.70 | -1.79 | 0.14 | -0.01 | 2.70 | 19.12 |
| 2020 | 5.07 | -6.93 | -20.79 | 8.37 | 4.27 | 2.42 | 2.38 | 2.05 | -3.79 | 1.71 | 7.23 | 2.25 | 0.47 |
| 2019 | 4.83 | 6.83 | 1.19 | 1.90 | 1.01 | 4.72 | 2.30 | -2.48 | 2.17 | 0.66 | 2.97 | -2.19 | 26.23 |
| 2018 | 0.14 | 1.54 | -3.84 | 5.08 | 2.22 | 3.35 | 1.95 | 1.47 | -1.93 | -7.11 | -4.75 | -0.65 | -3.22 |
| 2017 | -0.90 | 1.88 | 3.05 | 1.33 | -2.11 | 0.26 | -0.37 | 1.10 | 0.63 | 4.10 | 0.77 | 1.98 | 12.19 |
| 2016 | -5.19 | -2.06 | 4.17 | 1.50 | 3.62 | -2.17 | 6.96 | -1.59 | 0.84 | -1.23 | 3.70 | 4.67 | 13.27 |
| 2015 | 3.89 | 6.29 | 0.93 | -2.36 | 0.42 | -5.48 | 5.63 | -7.60 | -2.23 | 4.60 | 0.62 | 3.67 | 7.53 |
| 2014 | -3.72 | 4.92 | 0.54 | 2.51 | 0.64 | -1.77 | 4.00 | -0.09 | -5.51 | 4.11 | -2.29 | 2.49 | 5.36 |
| 2013 | 6.20 | 5.44 | -1.77 | 5.86 | -5.04 | -2.83 | 5.26 | 2.09 | 3.36 | 4.43 | -1.11 | 1.36 | 24.92 |
| 2012 | 4.80 | 2.54 | 1.51 | 1.91 | -7.80 | 2.45 | 4.03 | 3.15 | 1.27 | 4.10 | 0.71 | 3.27 | 23.55 |
| 2011 | 0.41 | 2.65 | 0.49 | -0.76 | -2.49 | -0.90 | -4.29 | -3.72 | -6.51 | 8.27 | -3.50 | -0.75 | -11.27 |
| 2010 | -7.04 | 3.39 | 6.22 | -2.64 | -6.45 | -3.81 | 5.51 | -4.03 | 5.24 | 3.56 | -1.63 | 3.32 | 0.32 |
| 2009 | -3.46 | -4.93 | 8.70 | 7.03 | 0.30 | 4.30 | 7.93 | 5.71 | 4.60 | -1.15 | 1.18 | 5.30 | 40.40 |
| 2008 | -10.63 | -3.73 | -6.64 | 1.97 | -0.45 | -10.93 | -1.19 | 2.74 | -13.08 | -15.95 | -11.82 | -1.80 | -53.36 |
| 2007 | 2.68 | -1.05 | 5.43 | 1.24 | 2.87 | 0.66 | -3.10 | -0.62 | 2.73 | 1.51 | -1.45 | -2.83 | 7.99 |
| 2006 | 3.10 | 0.56 | 6.87 | -0.12 | -3.74 | 0.56 | -0.15 | 4.28 | 4.22 | 4.33 | 2.17 | 2.68 | 27.24 |
| 2005 | 2.78 | 1.85 | -1.63 | -3.64 | 3.18 | 3.68 | 3.72 | 3.04 | 4.26 | -4.11 | 7.11 | 2.73 | 24.81 |
| 2004 | N/R | N/R | N/R | N/R | N/R | N/R | N/R | N/R | N/R | N/R | 4.97 | 3.55 | 8.71 |
Historical Financial Year Performance (all figures shown here are are percentage per month net of fees unless otherwise stated)
| Year | Jul % | Aug % | Sep % | Oct % | Nov % | Dec % | Jan % | Feb % | Mar % | Apr % | May % | Jun % | FYTD % |
|---|---|---|---|---|---|---|---|---|---|---|---|---|---|
| 2025/2026 | 2.37 | 3.24 | -1.79 | -0.59 | -2.88 | 2.27 | 1.01 | 7.29 | -7.52 | 0.07 | 1.89 | N/A | 4.73 |
| 2024/2025 | 3.98 | 0.65 | 2.77 | -0.66 | 4.97 | -2.49 | 4.45 | -4.01 | -2.38 | 3.03 | 4.30 | 1.61 | 16.90 |
| 2023/2024 | 1.73 | 0.46 | -2.85 | -3.51 | 4.23 | 6.31 | 1.57 | 1.13 | 3.02 | -3.95 | 1.51 | 1.64 | 11.32 |
| 2022/2023 | 4.14 | 2.01 | -6.09 | 5.90 | 5.85 | -3.44 | 6.15 | -1.34 | -0.61 | 1.58 | -2.79 | 1.50 | 12.64 |
| 2021/2022 | 2.05 | 1.70 | -1.79 | 0.14 | -0.01 | 2.70 | -5.39 | 1.86 | 5.21 | -0.79 | -2.41 | -7.55 | -4.88 |
| 2020/2021 | 2.38 | 2.05 | -3.79 | 1.71 | 7.23 | 2.25 | -0.12 | 2.31 | 3.09 | 3.65 | 2.42 | 1.63 | 27.39 |
| 2019/2020 | 2.30 | -2.48 | 2.17 | 0.66 | 2.97 | -2.19 | 5.07 | -6.93 | -20.79 | 8.37 | 4.27 | 2.42 | -7.38 |
| 2018/2019 | 1.95 | 1.47 | -1.93 | -7.11 | -4.75 | -0.65 | 4.83 | 6.83 | 1.19 | 1.90 | 1.01 | 4.72 | 8.93 |
| 2017/2018 | -0.37 | 1.10 | 0.63 | 4.10 | 0.77 | 1.98 | 0.14 | 1.54 | -3.84 | 5.08 | 2.22 | 3.35 | 17.69 |
| 2016/2017 | 6.96 | -1.59 | 0.84 | -1.23 | 3.70 | 4.67 | -0.90 | 1.88 | 3.05 | 1.33 | -2.11 | 0.26 | 17.75 |
| 2015/2016 | 5.63 | -7.60 | -2.23 | 4.60 | 0.62 | 3.67 | -5.19 | -2.06 | 4.17 | 1.50 | 3.62 | -2.17 | 3.63 |
| 2014/2015 | 4.00 | -0.09 | -5.51 | 4.11 | -2.29 | 2.49 | 3.89 | 6.29 | 0.93 | -2.36 | 0.42 | -5.48 | 5.72 |
| 2013/2014 | 5.26 | 2.09 | 3.36 | 4.43 | -1.11 | 1.36 | -3.72 | 4.92 | 0.54 | 2.51 | 0.64 | -1.77 | 19.65 |
| 2012/2013 | 4.03 | 3.15 | 1.27 | 4.10 | 0.71 | 3.27 | 6.20 | 5.44 | -1.77 | 5.86 | -5.04 | -2.83 | 26.42 |
| 2011/2012 | -4.29 | -3.72 | -6.51 | 8.27 | -3.50 | -0.75 | 4.80 | 2.54 | 1.51 | 1.91 | -7.80 | 2.45 | -6.18 |
| 2010/2011 | 5.51 | -4.03 | 5.24 | 3.56 | -1.63 | 3.32 | 0.41 | 2.65 | 0.49 | -0.76 | -2.49 | -0.90 | 11.40 |
| 2009/2010 | 7.93 | 5.71 | 4.60 | -1.15 | 1.18 | 5.30 | -7.04 | 3.39 | 6.22 | -2.64 | -6.45 | -3.81 | 12.41 |
| 2008/2009 | -1.19 | 2.74 | -13.08 | -15.95 | -11.82 | -1.80 | -3.46 | -4.93 | 8.70 | 7.03 | 0.30 | 4.30 | -28.25 |
| 2007/2008 | -3.10 | -0.62 | 2.73 | 1.51 | -1.45 | -2.83 | -10.63 | -3.73 | -6.64 | 1.97 | -0.45 | -10.93 | -30.17 |
| 2006/2007 | -0.15 | 4.28 | 4.22 | 4.33 | 2.17 | 2.68 | 2.68 | -1.05 | 5.43 | 1.24 | 2.87 | 0.66 | 33.38 |
| 2005/2006 | 3.72 | 3.04 | 4.26 | -4.11 | 7.11 | 2.73 | 3.10 | 0.56 | 6.87 | -0.12 | -3.74 | 0.56 | 25.96 |
| 2004/2005 | N/A | N/A | N/A | N/A | 4.97 | 3.55 | 2.78 | 1.85 | -1.63 | -3.64 | 3.18 | 3.68 | 15.39 |