AFM Fund Profile — Yarra Australian Share Wholesale Fund


- Fund & Manager Details
- Investment Details
- Performance & Risk
- Advanced Analytics
- Research & Availability
- News & Insights
- Documents
Fund & Manager Details
Key Facts
| Fund Type: | Single | Discretionary/Quantitative: | Discretionary |
| Strategy: | Equity Long | This Funds FUM (millions): | AU$201.2m |
| Style: | Value | Fund Inception Date: | Since 01 March 1995 |
| Geographic Mandate: | Australia | Latest Return Date: | May 2026 |
| Fund Domicile: | Australia | Investor Type: | Retail |
| Status: | Open | Reporting Status: | Current |
Manager Details and Fund Description
| Manager: | Tyndall Asset Management | Total FUM for all funds: | |
|
Manager Overview:
Tyndall Asset Management (Tyndall AM) is an investment team within the Yarra Group. The Tyndall AM investment team has worked together for more than 15 years and has a joint venture with the Yarra Group. This ownership structure ensures alignment of interests and fosters a strong performance culture.
Tyndall AM's Australian share valuation process is based on an intrinsic value philosophy. The team apply an internal research process called 'Comparative Value Analysis' to assess and compare the value of stocks and to identify companies whose shares may represent good value. |
Fund/Strategy Overview:
The Fund aims to provide a tax-effective income stream that exceeds the dividend yield of the S&P/ASX 200 Accumulation Index (grossed up for franking credits) by 2% p.a. over rolling five-year periods, before fees,
expenses and tax, plus the potential for capital growth over the long-term. Their proprietary research targets ASX-listed companies offering a tax-effective income stream and the potential for long-term capital growth over the medium to long term. The portfolio is constructed using their highest conviction ideas, with their style-neutral approach providing a reliable framework for delivering outperformance through market cycles. |
||
| Other funds operated by manager: | |||
| Yarra Australian Equity Income Fund | |||
Investment Details
Investment Terms
| Minimum Investment: | Minimum Additional Investment: | Minimum Term: | Investment Frequency: |
| AU$10,000 | AU$1,000 | Daily | |
| Regular Savings Option: | Regular Savings Min. Amount: |
Regular Savings Max. Amount: |
Regular Savings Freq.: |
| Yes | AU$250 | Monthly | |
| Redemption Notice: | Redemption Frequency: | Notes: | |
| 1 Days | Daily |
||
| Distributions: | Distribution Frequency: | Last Distribution Date: | Last Distribution Amount: |
| Yes | 6 Monthly | AU$ |
Structure
| Offshore/Onshore: | Fund Structure: | Share Classes: |
Trustee/Responsible Entity: |
| Onshore | Unit Trust | AU$ | Nikko Asset Management Australia Limited |
| Administrator: | Prime Broker: | Custodian: | Legal: |
| BNP Paribas Securities Services | N/A | BNP Paribas Securities Services | Internal & External Legal Panel |
Fund Fees
| Management Fee: |
Performance Fee: |
High Water Mark: |
Hurdle: |
| 0.8% | 0% | N/A | N/A |
| Buy Spread: | Sell spread: | Early Redemption Fee: | Fees Notes: |
| 0.250% | 0.250% | No |
Performance & Risk
Returns
| Latest Return Date: | Latest Result: | Fund Inception Date: | Annualised Return: |
| May 2026 | 0.72% | 01 March 1995 | 9.32% |
| Latest 3 Months: | Latest 6 Months: | Latest 12 Months: | Latest 2 Years p.a.: |
| -4.57% | 1.17% | 7.92% | 8.29% |
| Latest 3 Years p.a.: |
Latest 4 Years p.a.: |
Latest 5 Years p.a.: |
Latest 7 Years p.a.: |
| 7.63% | 5.86% | 6.61% | 6.66% |
Performance Statistics
| % Positive Months (S.I.): |
Average Return: | Average +ve Return: | Average -ve Return: |
| 62.93% | 0.83% | 3.22% | -3.22% |
| Best Month: | Worst Month: | Up Capture Ratio (S.I.): |
Down Capture Ratio (S.I.): |
| 14.54% | -25.77% | 82.92% | 99.69% |
| Largest Drawdown (S.I.): |
Longest Drawdown (S.I.): |
Current Drawdown (%): |
Current Drawdown (Months): |
| -46.12% | 63 months | -4.57% | 3 months |
Risk
| Annualised Standard Deviation (S.I.): |
Downside Deviation (S.I.): |
Sortino Ratio (S.I.): |
- |
| 14.08% | 10.08% | 0.50 | - |
| Sharpe Ratio (12 months): |
Sharpe Ratio (3 years): |
Sharpe Ratio (5 years): |
Sharpe Ratio (S.I.): |
| 0.40 | 0.38 | 0.37 | 0.43 |
| Please note, Sharpe and Sortino ratios are calculated using the Australian Risk Free Rate | |||
Ranking, Research & Availability
Fund Quintile in its Peer Group (Equity Long - Large Cap - Australia) as at April 2026
AFM's Quintile Rankings show performance and Key Performance Indicators (KPI's) of Yarra Australian Share Wholesale Fund compared to a peer group of funds with a similar strategy and geographic mandate. Each green square places a fund in one quintile (or 20%) of its peer group - five indicating that the fund is in the top (best) quintile for the corresponding KPI.
As a reference point the equivalent "quintile" performance of the peer group's underlying market index is also indicated by the red dot.
1 Year
3 Year
5 Year
7 Year
Yarra Australian Share Wholesale Fund
ASX200 Total Return
External Research and Ratings: As reported by each Fund Manager.
| Morningstar Star Rating: | 3 stars, February 2026 |
Availability:As reported by each Fund Manager.
Available on Investment Platforms:
OLIVIA123, BT Wrap, HUB24, Macquarie Wrap, OneVue, Netwealth, Powerwrap, Asgard, IOOF, MLC Wrap, North, BT Panorama, Colonial FirstWrap, MLC Navigator, Oasis, Ausmaq, OnePath, Mason Stevens, Praemium, ANZ
News & Insights

The need for unconventional oil
The need to transition to New Energy is well accepted, albeit the speed and the actual path taken remains less certain. That said, the transition is not a flick of a switch, where traditional energy sources are turned off and New Energy takes over. (9-minute read)
Read more...
Reporting season: volatility, value and the road ahead.
The August reporting season was anything but smooth. From gold rallies to blue-chip stumbles, the ASX delivered a wild ride.
Read more...
Is this now an opportunity for china exposed stocks?
After a significant price correction in China exposed stocks over the last year, Tyndall's Jason Kim recently went to China and met with various companies and industry experts to help determine whether some of these stocks now represent a real opportunity for investors.
Read more...
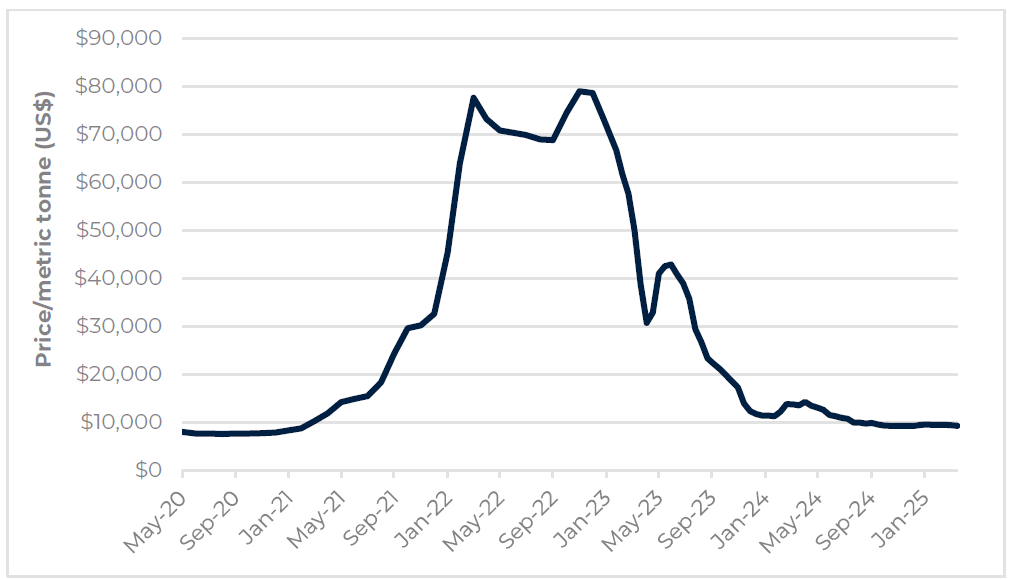
Have ASX iron ore stocks found their floor?
Recently, the People's Bank of China (PBOC) rolled out its most significant set of monetary easing policies since 2015. These measures were designed to address China's ongoing property sector challenges and provide a broader boost to economic growth.
Read more...
Fund Performance
Historical Performance (all figures shown here are net of fees unless otherwise stated)
| Year | Jan % | Feb % | Mar % | Apr % | May % | Jun % | Jul % | Aug % | Sep % | Oct % | Nov % | Dec % | YTD % |
|---|---|---|---|---|---|---|---|---|---|---|---|---|---|
| 2026 | 1.10 | 3.92 | -8.85 | 3.95 | 0.72 | N/R | N/R | N/R | N/R | N/R | N/R | N/R | 0.26 |
| 2025 | 4.21 | -2.30 | -2.02 | 2.92 | 2.96 | 1.08 | 3.21 | 3.25 | -0.46 | 0.94 | -1.43 | 0.90 | 13.78 |
| 2024 | 1.37 | -0.22 | 3.85 | -1.78 | -0.07 | 0.08 | 4.44 | 0.41 | 2.80 | -3.05 | 2.38 | -4.02 | 5.97 |
| 2023 | 5.06 | -1.62 | -0.72 | 1.59 | -2.41 | 1.97 | 2.75 | -2.86 | -1.90 | -4.20 | 2.50 | 5.20 | 4.93 |
| 2022 | -2.39 | 4.04 | 5.34 | 0.06 | -1.27 | -6.66 | 2.05 | 2.00 | -5.01 | 4.77 | 5.88 | -3.30 | 4.62 |
| 2021 | 0.90 | 5.35 | 3.06 | 2.80 | 2.63 | 1.47 | 0.49 | 3.28 | -0.46 | -0.64 | -3.20 | 2.94 | 19.96 |
| 2020 | 2.73 | -9.57 | -25.77 | 11.30 | 4.12 | 0.10 | -1.99 | 4.39 | -4.13 | 0.70 | 14.54 | 0.60 | -8.96 |
| 2019 | 4.49 | 7.61 | -1.01 | 2.31 | 0.20 | 2.73 | 2.81 | -3.38 | 4.89 | 0.57 | 2.82 | -2.13 | 23.60 |
| 2018 | -1.12 | 0.29 | -3.63 | 3.91 | 0.10 | 3.28 | 2.21 | -1.02 | -1.12 | -8.85 | -5.01 | -4.03 | -14.67 |
| 2017 | -0.83 | 2.30 | 4.22 | 2.15 | -2.26 | 0.96 | -0.18 | -1.04 | 1.23 | 4.52 | 0.70 | 3.41 | 16.00 |
| 2016 | -6.76 | -0.96 | 5.37 | 1.72 | 4.22 | -3.84 | 7.21 | -1.20 | -0.03 | -1.40 | 4.19 | 6.41 | 14.82 |
| 2015 | 2.61 | 6.31 | 0.72 | -3.01 | 0.68 | -5.14 | 4.89 | -7.27 | -3.26 | 4.14 | -1.10 | 2.41 | 0.99 |
| 2014 | -3.62 | 4.44 | -0.10 | 1.59 | 1.30 | -2.14 | 5.08 | 0.95 | -4.77 | 3.34 | -2.05 | 3.75 | 7.42 |
| 2013 | 5.16 | 5.40 | -2.57 | 5.17 | -3.13 | -3.46 | 5.58 | 2.61 | 3.06 | 3.44 | -1.15 | 1.66 | 23.26 |
| 2012 | 5.30 | 2.07 | 1.62 | 1.38 | -7.34 | 0.14 | 3.64 | 2.56 | 1.42 | 3.53 | 0.90 | 4.13 | 20.46 |
| 2011 | -0.31 | 2.85 | 1.86 | -1.08 | -1.52 | -1.30 | -4.20 | -3.52 | -5.57 | 8.55 | -4.14 | -1.23 | -9.92 |
| 2010 | -5.98 | 0.75 | 5.01 | -1.62 | -7.49 | -3.67 | 5.38 | -3.68 | 4.03 | 2.04 | -0.22 | 4.09 | -2.41 |
| 2009 | -5.27 | -7.19 | 12.43 | 5.21 | 1.85 | 4.31 | 9.14 | 6.67 | 6.45 | -2.53 | 2.47 | 5.14 | 43.78 |
| 2008 | -8.00 | -0.77 | -3.05 | 3.33 | 0.64 | -8.17 | -3.58 | 3.35 | -9.18 | -9.86 | -8.53 | 0.19 | -36.80 |
| 2007 | 2.62 | 0.85 | 4.25 | 2.42 | 1.85 | -0.31 | -1.97 | 2.71 | 4.39 | 1.99 | -1.40 | -1.64 | 16.64 |
| 2006 | 1.49 | 0.25 | 5.46 | 1.95 | -5.14 | 2.27 | -2.22 | 3.39 | 0.85 | 6.52 | 0.45 | 3.17 | 19.45 |
| 2005 | 2.09 | 4.02 | -1.00 | -4.61 | 3.40 | 5.37 | 2.46 | 2.50 | 4.90 | -5.06 | 3.86 | 2.02 | 21.06 |
| 2004 | -0.83 | 1.98 | 2.45 | -0.83 | 1.50 | 3.12 | 1.43 | 1.96 | 4.35 | 2.10 | 4.57 | 2.89 | 27.50 |
| 2003 | -1.72 | -4.78 | 3.82 | 4.18 | 1.68 | 1.88 | 5.24 | 3.23 | 0.36 | 3.07 | -2.83 | 4.67 | 19.83 |
| 2002 | 4.34 | 1.47 | 1.57 | -1.00 | 3.83 | -3.17 | -3.41 | 3.07 | -2.96 | 2.14 | 1.17 | -0.70 | 6.11 |
| 2001 | 4.43 | -1.48 | -3.53 | 5.60 | 2.63 | 4.05 | -0.71 | -2.10 | -6.17 | 7.16 | 8.41 | 3.55 | 22.79 |
| 2000 | -0.99 | -10.87 | 1.52 | 2.34 | 0.25 | 9.37 | 2.39 | -1.12 | -1.61 | 3.38 | 2.91 | -0.94 | 5.52 |
| 1999 | 0.62 | 3.36 | -0.04 | 9.58 | -2.37 | 1.26 | 1.24 | -3.75 | -4.32 | -1.64 | 2.43 | -0.97 | 4.77 |
| 1998 | -0.50 | -2.28 | 2.93 | 1.21 | -1.62 | -7.38 | -0.37 | -11.32 | 4.60 | 5.80 | 3.79 | -0.19 | -6.52 |
| 1997 | 0.67 | 4.49 | 0.91 | 4.07 | 6.11 | 4.16 | 2.65 | -2.77 | 8.26 | -9.57 | 1.93 | 5.92 | 28.81 |
| 1996 | 2.60 | 1.07 | -1.66 | 4.42 | -3.76 | 0.81 | -0.70 | 3.06 | 3.38 | 5.05 | 2.95 | 4.10 | 23.06 |
| 1995 | N/R | N/R | -1.27 | 3.49 | -1.69 | 0.61 | 1.10 | 2.53 | 1.87 | -0.84 | 3.53 | 2.67 | 12.46 |
Historical Financial Year Performance (all figures shown here are are percentage per month net of fees unless otherwise stated)
| Year | Jul % | Aug % | Sep % | Oct % | Nov % | Dec % | Jan % | Feb % | Mar % | Apr % | May % | Jun % | FYTD % |
|---|---|---|---|---|---|---|---|---|---|---|---|---|---|
| 2025/2026 | 3.21 | 3.25 | -0.46 | 0.94 | -1.43 | 0.90 | 1.10 | 3.92 | -8.85 | 3.95 | 0.72 | N/A | 6.77 |
| 2024/2025 | 4.44 | 0.41 | 2.80 | -3.05 | 2.38 | -4.02 | 4.21 | -2.30 | -2.02 | 2.92 | 2.96 | 1.08 | 9.74 |
| 2023/2024 | 2.75 | -2.86 | -1.90 | -4.20 | 2.50 | 5.20 | 1.37 | -0.22 | 3.85 | -1.78 | -0.07 | 0.08 | 4.37 |
| 2022/2023 | 2.05 | 2.00 | -5.01 | 4.77 | 5.88 | -3.30 | 5.06 | -1.62 | -0.72 | 1.59 | -2.41 | 1.97 | 10.03 |
| 2021/2022 | 0.49 | 3.28 | -0.46 | -0.64 | -3.20 | 2.94 | -2.39 | 4.04 | 5.34 | 0.06 | -1.27 | -6.66 | 0.90 |
| 2020/2021 | -1.99 | 4.39 | -4.13 | 0.70 | 14.54 | 0.60 | 0.90 | 5.35 | 3.06 | 2.80 | 2.63 | 1.47 | 33.48 |
| 2019/2020 | 2.81 | -3.38 | 4.89 | 0.57 | 2.82 | -2.13 | 2.73 | -9.57 | -25.77 | 11.30 | 4.12 | 0.10 | -15.66 |
| 2018/2019 | 2.21 | -1.02 | -1.12 | -8.85 | -5.01 | -4.03 | 4.49 | 7.61 | -1.01 | 2.31 | 0.20 | 2.73 | -2.56 |
| 2017/2018 | -0.18 | -1.04 | 1.23 | 4.52 | 0.70 | 3.41 | -1.12 | 0.29 | -3.63 | 3.91 | 0.10 | 3.28 | 11.74 |
| 2016/2017 | 7.21 | -1.20 | -0.03 | -1.40 | 4.19 | 6.41 | -0.83 | 2.30 | 4.22 | 2.15 | -2.26 | 0.96 | 23.37 |
| 2015/2016 | 4.89 | -7.27 | -3.26 | 4.14 | -1.10 | 2.41 | -6.76 | -0.96 | 5.37 | 1.72 | 4.22 | -3.84 | -1.56 |
| 2014/2015 | 5.08 | 0.95 | -4.77 | 3.34 | -2.05 | 3.75 | 2.61 | 6.31 | 0.72 | -3.01 | 0.68 | -5.14 | 7.95 |
| 2013/2014 | 5.58 | 2.61 | 3.06 | 3.44 | -1.15 | 1.66 | -3.62 | 4.44 | -0.10 | 1.59 | 1.30 | -2.14 | 17.52 |
| 2012/2013 | 3.64 | 2.56 | 1.42 | 3.53 | 0.90 | 4.13 | 5.16 | 5.40 | -2.57 | 5.17 | -3.13 | -3.46 | 24.53 |
| 2011/2012 | -4.20 | -3.52 | -5.57 | 8.55 | -4.14 | -1.23 | 5.30 | 2.07 | 1.62 | 1.38 | -7.34 | 0.14 | -7.84 |
| 2010/2011 | 5.38 | -3.68 | 4.03 | 2.04 | -0.22 | 4.09 | -0.31 | 2.85 | 1.86 | -1.08 | -1.52 | -1.30 | 12.37 |
| 2009/2010 | 9.14 | 6.67 | 6.45 | -2.53 | 2.47 | 5.14 | -5.98 | 0.75 | 5.01 | -1.62 | -7.49 | -3.67 | 13.48 |
| 2008/2009 | -3.58 | 3.35 | -9.18 | -9.86 | -8.53 | 0.19 | -5.27 | -7.19 | 12.43 | 5.21 | 1.85 | 4.31 | -17.40 |
| 2007/2008 | -1.97 | 2.71 | 4.39 | 1.99 | -1.40 | -1.64 | -8.00 | -0.77 | -3.05 | 3.33 | 0.64 | -8.17 | -12.11 |
| 2006/2007 | -2.22 | 3.39 | 0.85 | 6.52 | 0.45 | 3.17 | 2.62 | 0.85 | 4.25 | 2.42 | 1.85 | -0.31 | 26.29 |
| 2005/2006 | 2.46 | 2.50 | 4.90 | -5.06 | 3.86 | 2.02 | 1.49 | 0.25 | 5.46 | 1.95 | -5.14 | 2.27 | 17.59 |
| 2004/2005 | 1.43 | 1.96 | 4.35 | 2.10 | 4.57 | 2.89 | 2.09 | 4.02 | -1.00 | -4.61 | 3.40 | 5.37 | 29.51 |
| 2003/2004 | 5.24 | 3.23 | 0.36 | 3.07 | -2.83 | 4.67 | -0.83 | 1.98 | 2.45 | -0.83 | 1.50 | 3.12 | 22.91 |
| 2002/2003 | -3.41 | 3.07 | -2.96 | 2.14 | 1.17 | -0.70 | -1.72 | -4.78 | 3.82 | 4.18 | 1.68 | 1.88 | 3.94 |
| 2001/2002 | -0.71 | -2.10 | -6.17 | 7.16 | 8.41 | 3.55 | 4.34 | 1.47 | 1.57 | -1.00 | 3.83 | -3.17 | 17.44 |
| 2000/2001 | 2.39 | -1.12 | -1.61 | 3.38 | 2.91 | -0.94 | 4.43 | -1.48 | -3.53 | 5.60 | 2.63 | 4.05 | 17.48 |
| 1999/2000 | 1.24 | -3.75 | -4.32 | -1.64 | 2.43 | -0.97 | -0.99 | -10.87 | 1.52 | 2.34 | 0.25 | 9.37 | -6.48 |
| 1998/1999 | -0.37 | -11.32 | 4.60 | 5.80 | 3.79 | -0.19 | 0.62 | 3.36 | -0.04 | 9.58 | -2.37 | 1.26 | 14.08 |
| 1997/1998 | 2.65 | -2.77 | 8.26 | -9.57 | 1.93 | 5.92 | -0.50 | -2.28 | 2.93 | 1.21 | -1.62 | -7.38 | -2.64 |
| 1996/1997 | -0.70 | 3.06 | 3.38 | 5.05 | 2.95 | 4.10 | 0.67 | 4.49 | 0.91 | 4.07 | 6.11 | 4.16 | 45.44 |
| 1995/1996 | 1.10 | 2.53 | 1.87 | -0.84 | 3.53 | 2.67 | 2.60 | 1.07 | -1.66 | 4.42 | -3.76 | 0.81 | 14.97 |
| 1994/1995 | N/A | N/A | N/A | N/A | N/A | N/A | N/A | N/A | -1.27 | 3.49 | -1.69 | 0.61 | 1.06 |