| Fund Type: | Single | Discretionary/Quantitative: |
Discretionary |
| Strategy: | Equity Long | FUM (millions): | AU$9.52m |
| Style: | Growth | Fund Inception Date: | Since 01 July 2019 |
| Geographic Mandate: | Global | Latest Return Date: | October 2022 |
| Fund Domicile: | Australia | Investor Type: | Wholesale |
| Status: | Closed | Reporting Status: | Ceased Reporting |
| Manager: | Holon Global Investments Limited | Total FUM for all funds: | AU$13.09m |
|
Manager Overview:
The responsible entity for the Holon Photon Fund (ARSN 633 803 497) is One Managed Investment Funds Limited (ACN 117 400 987) (AFSL 297042) (OMIFL). The investment manager for the Holon Photon Fund is Holon Global Asset Management Pty Ltd (ACN 629 590 585) (Holon) that is a wholly owned subsidiary of Holon Global Investments Limited (ACN 129 237 592). Holon is an Australian Financial Services Representative (No. 1276082) of Atlas Funds Management Pty Ltd (ACN 612 499 528) which holds an Australian Financial Services Licence (No. 491395).
Holon is a global equities manager focussed on innovation and investor aligned wealth management. Established in 2018, Holon brings together a team of experienced investment and business professionals with global investment experience across institutional, hedge funds and private equity. Our primary goal is to grow the wealth of Australians through intelligent and responsible investing. |
Fund/Strategy Overview:
The Investment strategy for the Fund is to invest in listed companies with global opportunity sets, benefiting primarily from innovation. In particular, the Fund will focus on digital innovation, enabling and driving a number of new emerging sectors and companies with the unusual economic characteristics of having strong network effects, and the ability to scale rapidly and serve global markets.
The Photon Fund looks to hold a maximum of 22 positions. It will be unhedged and will not employ derivatives. |
||
| Minimum Investment: | Minimum Additional Investment: | Minimum Term: | Investment Frequency: |
| AU$5,000 | AU$1,000 | Daily | |
| Regular Savings Option: | Regular Savings Min. Amount : |
Regular Savings Max. Amount : |
Regular Savings Freq.: |
| No | N/A | ||
| Redemption Notice: | Redemption Frequency: | Notes: | |
| Daily |
|||
| Distributions: | Distribution Frequency: | Last Distribution Date: | Last Distribution Amount: |
| Yes | Annually | AU$ |
| Offshore/Onshore: | Fund Structure: | Share Classes: |
Trustee/Responsible Entity: |
| Onshore | Unit Trust | AU$ | One Managed Investment Funds Limited |
| Administrator: | Prime Broker: | Custodian: | Legal: |
| Unity Fund Services Pty Ltd | N/A | Interactive Brokers | McMahon Clarke |
| Management Fee: |
Performance Fee: |
High Water Mark: |
Hurdle: |
| 0.85% | 15% | Yes | N/A |
| Buy Spread: | Sell spread: | Early Redemption Fee: | Fees Notes: |
| 0.150% | 0.150% | No | Performance fee is 15% of the amount by... |
| Latest Return Date: | Latest Result: | Fund Inception Date: | Annualised Return: |
| October 2022 | -6.64% | 01 July 2019 | 0.28% |
| Latest 3 Months: | Latest 6 Months: | Latest 12 Months: | Latest 2 Years p.a.: |
| -13.79% | -22.63% | -43.66% | -15.93% |
| Latest 3 Years p.a.: |
Latest 4 Years p.a.: |
Latest 5 Years p.a.: |
Latest 7 Years p.a.: |
| -0.66% | N/A | N/A | N/A |
| % Positive Months (S.I.): |
Average Return: | Average +ve Return: | Average -ve Return: |
| 52.50% | 0.19% | 4.67% | -4.76% |
| Best Month: | Worst Month: | Up Capture Ratio (S.I.): |
Down Capture Ratio (S.I.): |
| 13.20% | -11.37% | 77.34% | 123.85% |
| Largest Drawdown (S.I.): |
Longest Drawdown (S.I.): |
Current Drawdown (%): |
Current Drawdown (Months): |
| -44.29% | 16 months | -44.29% | 16 months |
| Annualised Standard Deviation (S.I.): |
Downside Deviation (S.I.): |
Sortino Ratio (S.I.): |
- |
| 20.13% | 13.48% | -0.02 | - |
| Sharpe Ratio (12 months): |
Sharpe Ratio (3 years): |
Sharpe Ratio (5 years): |
Sharpe Ratio (S.I.): |
| -4.09 | 0.05 | N/A | 0.09 |
| Please note, Sharpe and Sortino ratios are calculated using the Australian Risk Free Rate | |||
AFM's Quintile Rankings show performance and Key Performance Indicators (KPI's) of Holon Photon Fund compared to a peer group of funds with a similar strategy and geographic mandate. Each green square places a fund in one quintile (or 20%) of its peer group - five indicating that the fund is in the top (best) quintile for the corresponding KPI.
As a reference point the equivalent "quintile" performance of the peer group's underlying market index is also indicated by the red dot.
Quintile data is pending for Holon Photon Fund.
| SQM: | Favourable: 3.75 stars, April 2021 |
Historical Performance (all figures shown here are net of fees unless otherwise stated)
| Year | Jan % | Feb % | Mar % | Apr % | May % | Jun % | Jul % | Aug % | Sep % | Oct % | Nov % | Dec % | YTD % |
|---|---|---|---|---|---|---|---|---|---|---|---|---|---|
| 2022 | -7.77 | -6.61 | 1.94 | -11.37 | -7.34 | -3.09 | -0.05 | -1.00 | -6.73 | -6.64 | N/R | N/R | -39.79 |
| 2021 | 7.04 | -0.14 | -2.98 | 4.10 | -5.10 | 13.20 | -5.30 | 2.51 | -5.73 | 8.06 | 0.52 | -6.91 | 7.31 |
| 2020 | 7.62 | -3.64 | -6.40 | 9.95 | 3.66 | 3.14 | 4.83 | 12.56 | -3.46 | 2.11 | 6.16 | 3.05 | 45.20 |
| 2019 | N/R | N/R | N/R | N/R | N/R | N/R | 1.62 | 0.24 | 0.79 | 0.27 | 4.78 | -0.26 | 7.59 |
Historical Financial Year Performance (all figures shown here are are percentage per month net of fees unless otherwise stated)
| Year | Jul % | Aug % | Sep % | Oct % | Nov % | Dec % | Jan % | Feb % | Mar % | Apr % | May % | Jun % | FYTD % |
|---|---|---|---|---|---|---|---|---|---|---|---|---|---|
| 2022/2023 | -0.05 | -1.00 | -6.73 | -6.64 | N/A | N/A | N/A | N/A | N/A | N/A | N/A | N/A | -13.84 |
| 2021/2022 | -5.30 | 2.51 | -5.73 | 8.06 | 0.52 | -6.91 | -7.77 | -6.61 | 1.94 | -11.37 | -7.34 | -3.09 | -35.34 |
| 2020/2021 | 4.83 | 12.56 | -3.46 | 2.11 | 6.16 | 3.05 | 7.04 | -0.14 | -2.98 | 4.10 | -5.10 | 13.20 | 47.58 |
| 2019/2020 | 1.62 | 0.24 | 0.79 | 0.27 | 4.78 | -0.26 | 7.62 | -3.64 | -6.40 | 9.95 | 3.66 | 3.14 | 22.76 |
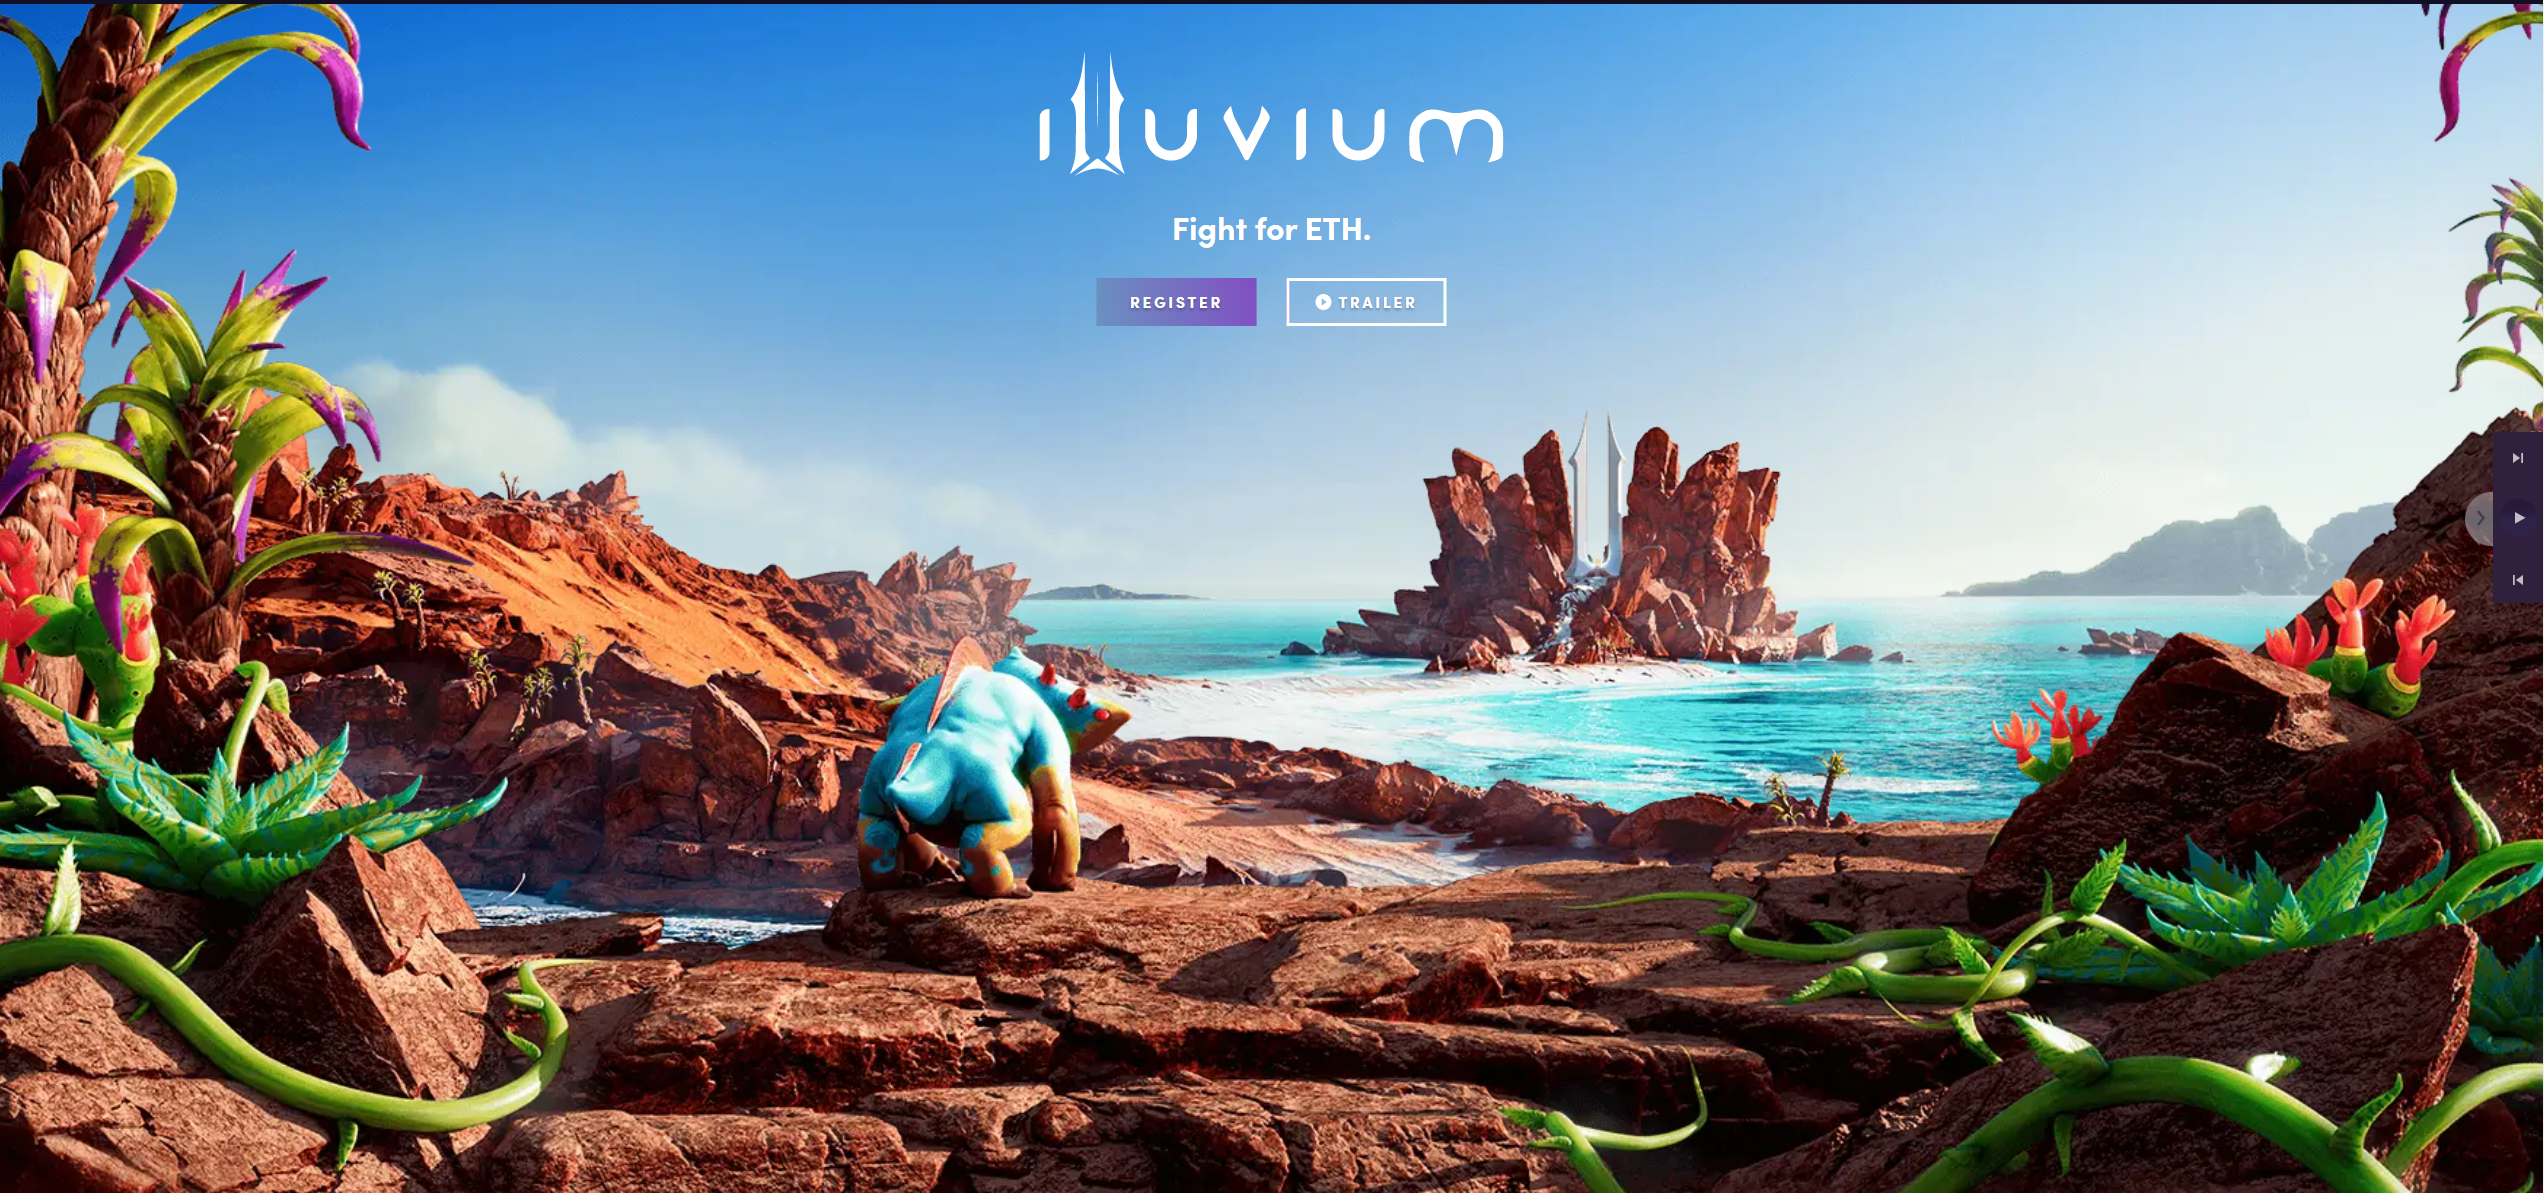 In simpler words, Illuvium is a remake of the incredibly popular 'Pokemon', only with much better graphics and NFTs that enable you to actually own parts of the game, including the creatures.