Europe continues to dominate in the green bond space in 2023, with most green bonds issued either by a European name or denominated in EUR. Following Poland as the first sovereign to issue a green bond in 2016, supply and demand for Supranational, Sub-Sovereign and Agency (SSA) green bonds in Europe has continued to grow. Whilst it's unlikely we will see a repeat of 2021's bumper year, the outlook for Q4 2023 remains healthy. S&P forecasts green, social, sustainable, and sustainability-linked bond (GSSSB) issuance will be $US900 billion to $US1 trillion, or 14% to 16% of total issuance in 2023, with green bonds dominating the labelled bond market.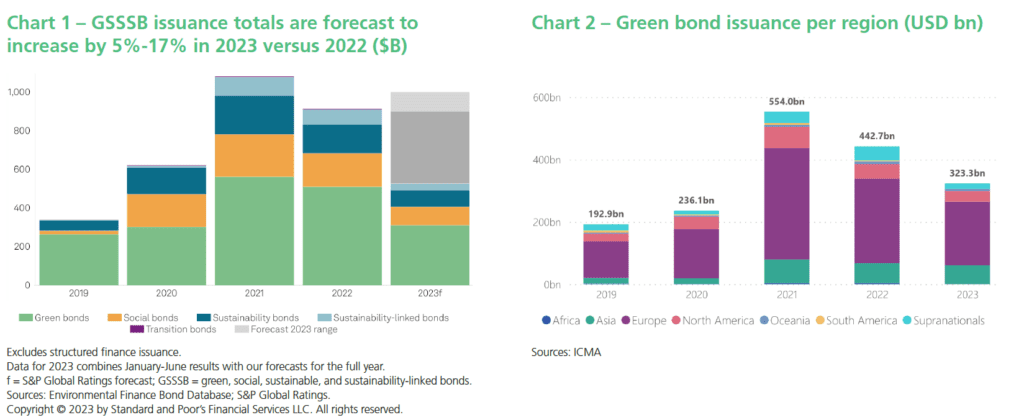
Make it green
Political developments have been the driving force behind Europe's dominance in the sovereign green bond space, and investors have welcomed new issuance with open arms. The European Union (EU) has consistently put green projects at the top of their agenda, with initiatives such as the Europe Green Deal and Re Power EU creating projects that can be funded by green bonds. Further proving its commitment as an issuer in its own right, the EU has committed to funding through green bonds up to 30% or 250bn EUR of its Next Generation EU (NGEU) program, which is designed to repair the economic and social damage caused by the COVID-19 pandemic. This would make the EU the largest SSA issuer of green bonds in the world helping to solidify the future of the global green bond market.
The EU has also been a leader on the regulatory front. In June 2023, a new set of rules known as the European Green Bonds Standard (EUGBS) were agreed upon. As concerns over greenwashing in a rapidly growing market persist, this was a step towards greater transparency and reporting obligations from those issuing green bonds. Issuers who wish to use the EUGBS label will need to ensure that at least 85% of activities that a green bond finances complies with the EU taxonomy for sustainable activities. The taxonomy is a stringent classification system that defines criteria for economic activities that are aligned with a net zero trajectory by 2050 and broader environmental goals beyond climate.
In the sovereign space, the new Netherlands 2044 green bond was the final large supply point of the year along with some smaller taps of existing bonds from the likes of Germany and France. The NGEU program could be the potential highlight for this final quarter with investors and market makers repeatedly calling for another syndicated green bond this year.
It's not easy being green
Whilst politics has been the key driver in Europe, in the UK and US it's a very different tone. The British Prime Minister, Rishi Sunak, recently announced that two key net zero policies, the ban on the sale of new petrol and diesel cars and replacing gas boilers in existing homes, will both be delayed from the initial targets. Whilst the UK started strongly with, at the time, the largest inaugural green bond issue of £10bn back in 2021, green funding requirements have failed to take off with this financial year seeing less than 5% of total issuance being in green bonds. A lack of available projects has repeatedly been cited as the reason behind the amount of green bond issuance stagnating year on year. Whilst the government has reiterated its commitments to net zero, with other economic and political challenges on the table as well as an election next year, it's perhaps unsurprising that the green bond market is less of a focus than in Europe.
Similarly, in the US, green policies and the subsequent funding requirements have failed to gain traction in mainstream politics. The US Treasury is yet to make any commitment to issue its inaugural green bond, and whilst there are some green bonds denominated in USD, they tend to be from non-US names. It is most telling perhaps that large US corporates choose to issue their green bonds in EUR rather than in USD.
Looking forward
Whilst Europe has been the driving force behind green bond markets to date, others are catching up with many analysts seeing the most growth coming from Asian and Emerging Market names in 2024. The new EU regulatory standards for green bonds will certainly raise the bar for issuers but it is clear that this is a thriving market with plenty of opportunity for growth and one which issuers, and in turn investors, won't be able to ignore.